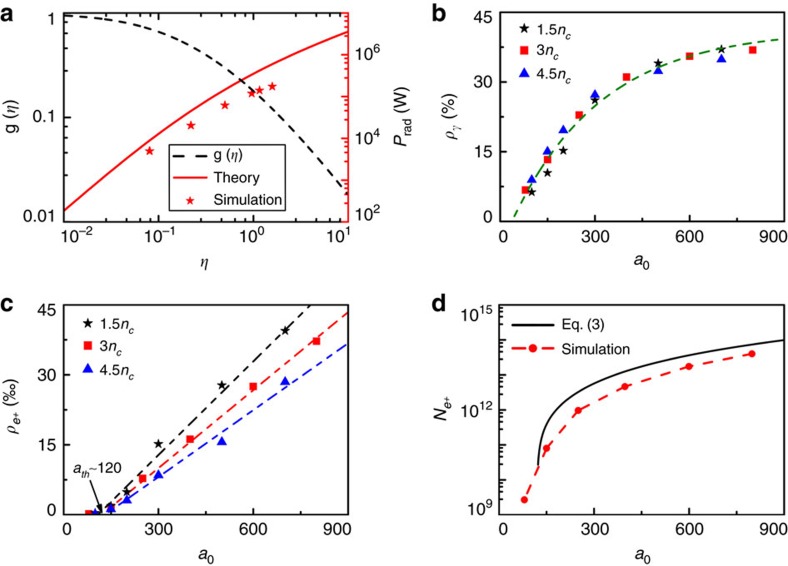
Figure 4. Results of theoretical predictions and numerical simulations.
(a) The electron radiation power (red line) and the function g(η) (black dashed line) as a function of the parameter η in our scheme. The red asterisks represent the simulation results. The laser energy conversion efficiency to (b) the γ-photons and (c) positrons with different laser intensities and plasma densities. Here the green dashed line in b shows the fitted results. Note that there exists a laser threshold intensity in (c), ath∼120, for efficient positron production in our configuration. (d) The positron yield as a function of the laser intensity, based on the equation (3) and PIC simulations.

