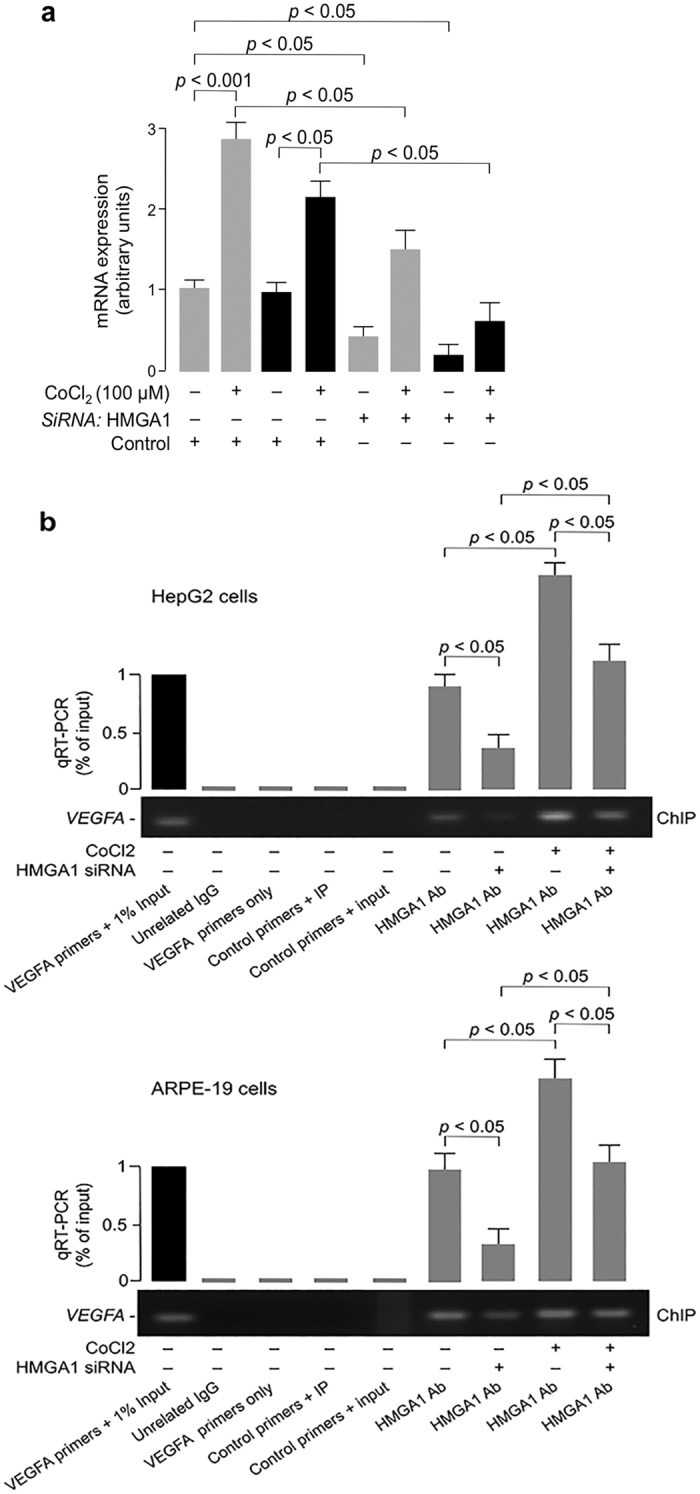
Figure 3. HMGA1 and VEGFA expression in hypoxia.

(a) Effect of hypoxia on VEGFA (gray bars) and HMGA1 (black bars) mRNA, in HepG2 cells preatreated or not with anti-HMGA1 siRNA, as measured by qRT-PCR. Data are means ± s.e.m of three independent experiments, each performed in triplicate. (b) ChIP of the VEGFA promoter gene in HepG2 and ARPE-19 cells, either untreated or pretreated with siRNA against HMGA1, both in normoxic and hypoxic conditions, using an anti-HMGA1 specific antibody (Ab). Representative assays are shown, together with qRT-PCR of ChIP-ed samples. Cropped gels are shown in the figures. Full-length ChIPs are presented in Supplementary Fig. S1.
