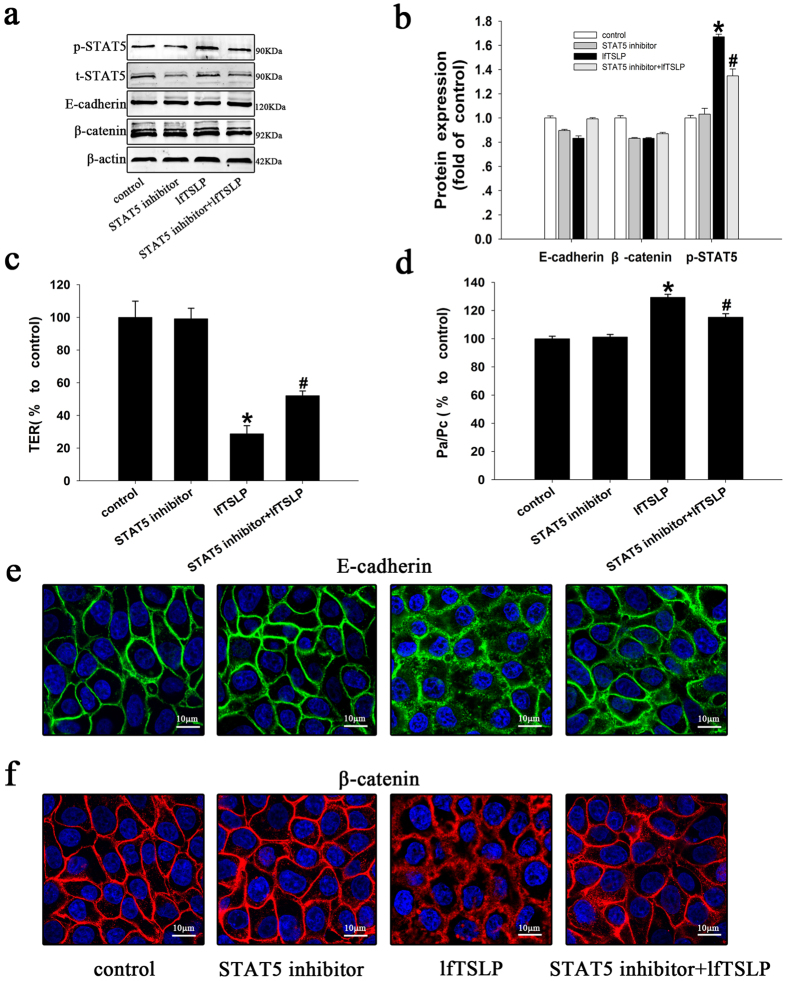
Figure 4. Involvement of STAT5 phosphorylationin lfTSLP-induced barrier dysfunction in 16HBE cells.
16HBE cells were treated with culture medium (control group), STAT5 inhibitor (10 μM), or lfTSLP (10 ng/ml) with or without STAT5 inhibitor (10 μM) for 1 h prior to stimulation with lfTSLP. (a,b) p-STAT5, t-STAT5, E-cadherin, and β-catenin protein expression was evaluated by western blotting and densitometric analyses. (c) TER and (d) FITC-Dx permeability was measured in the treated cells. (e) The distribution of E-cadherin was monitored using immunofluorescence. Green represents E-cadherin, blue represents the nucleus. (f) The distribution of β-catenin was monitored using immunofluorescence. Red represents β-catenin, blue represents the nucleus. Data are presented as the mean ± SD; n = 3–4. *P < 0.05 vs. the control group; #P < 0.05 vs. the lfTSLP group.

