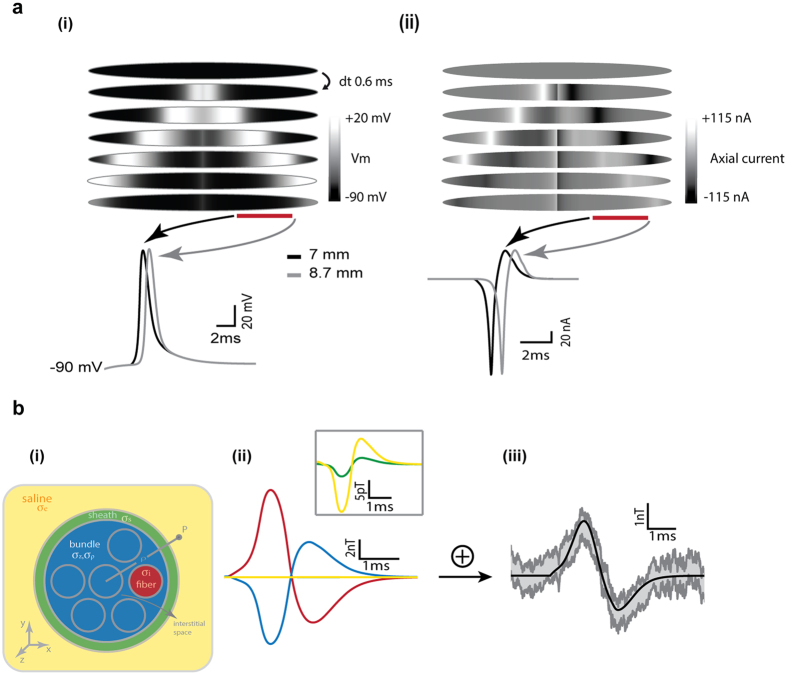
Figure 4. Modeling versus experiments.
(a) (i) Evolution of the membrane potential along the muscle fiber for successive times. The time evolution of the membrane potential during the AP in two different sites of the fiber corresponding to the two ends of the probe is depicted on the bottom. The time lapse between the two AP peak is 0.7 ms, corresponding to an AP speed of 2.4 m/s. (ii) Same as in (i) but for the axial currents generated by the membrane potential gradients along the fiber. (b) (i) Scheme of the muscle section with the different sub-regions depicted in different colors. (ii) The components of the calculated magnetic field due to the currents flowing in the different regions depicted in (i): the fibers (red), the bundle (blue) and the sheath and bath saline (green and yellow traces respectively in the main panel and in the inset). (iii) The calculated net magnetic field (black) resulting from the superposition of the components shown in (ii) is compared with the data (gray) obtained from one muscle (mean ± SE; n = 450 trials). The best agreement between theory and experiments was obtained for σi = 1.5 S/m, σp = 0.01 S/m, σz = 4.5 S/m and σs = 3 S/m.

