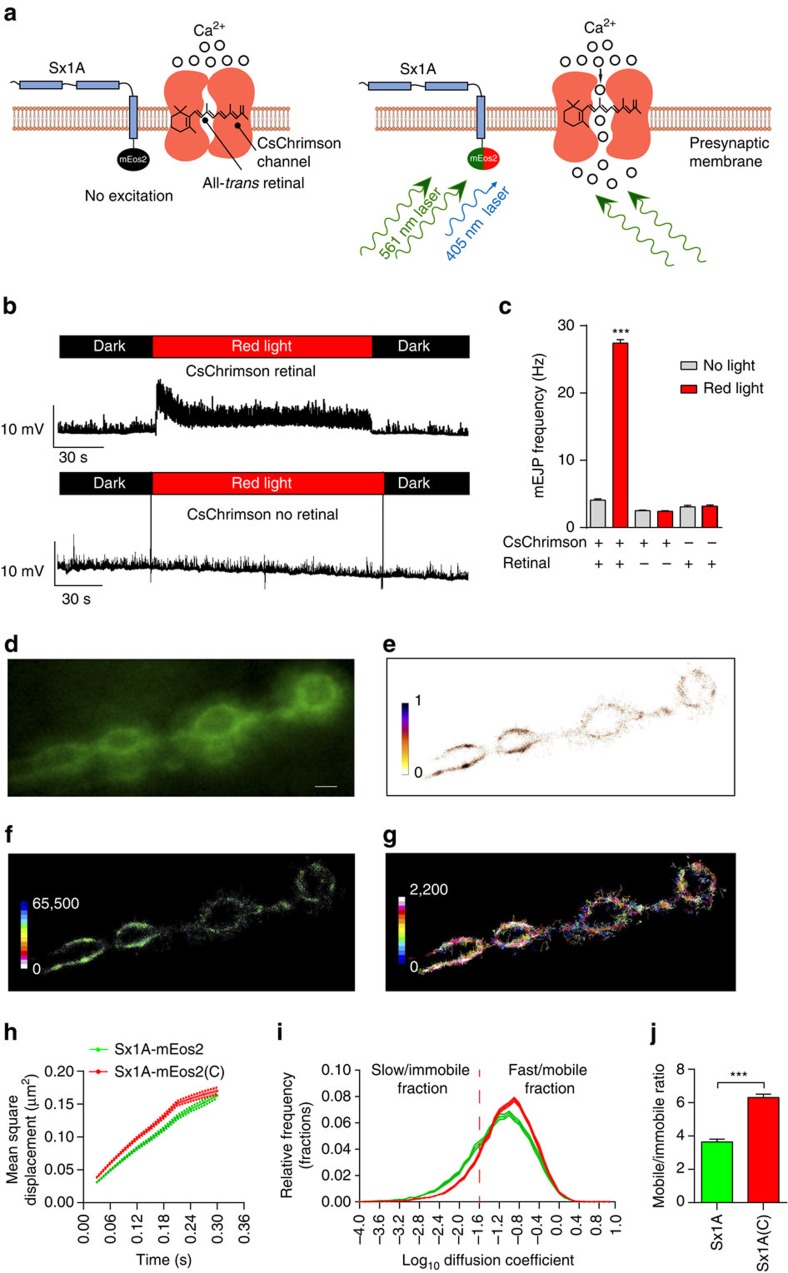
Figure 4. Optogenetic-induced rise in presynaptic activity increases Sx1A-mEos2 mobility in motor nerve terminals.
Sx1A-mEos2 mobility was imaged at 33 Hz in larvae expressing the channelrhodopsin CsChrimson that had been fed with retinal. (a) Schematic diagram of presynaptic membrane with Sx1A-mEos2 and CsChrimson molecules. The excitation 561 nm beam used to image photoconverted Sx1A-mEos2 was simultaneously also used to elicit the opening of the CsChrimson cation channels. (b,c) Electrophysiological traces from the abdominal muscle 6 of CsChrimson- and Sx1A-mEos2-expressing larvae. Note that the mEJP frequency in retinal-fed larvae stimulated with far-red light is significantly higher (27.4±0.5 mEJPs per s) than that of control larvae with no light stimulation (4.1±0.2 mEJPs per s), no CsChrimson expression (far-red light, 3.1±0.2 mEJPs per s and no far-red light, 3.2±0.2 mEJPs per s) and not fed with retinal (far-red light, 2.42±0.10 mEJPs per s and no far-red light, 2.5±0.1 mEJPs per s). Comparisons were performed using one-way analysis of variance with Dunnett’s multiple comparison test ***P<0.001. (d–g) Representative low-resolution image, sptPALM average intensity, diffusion coefficient and trajectory map of Sx1A-mEos2 in CsChrimson-expressing larvae that had been fed with retinal (1,853 trajectories analysed). Scale bar, 5 μm. (h,i) Note that optogenetic-induced presynaptic activity increased the MSD and the diffusion coefficient distribution. C, CsChrimson. (j) The ratio of mobile to immobile fractions significantly increased from 3.6±0.15 to 6.31±0.2 (n=21 NMJ chains for Sx1A-mEos2 and CsChrimson-retinal and 19 NMJ chains for Sx1A-mEos2 only; average of ∼3,200 trajectories analysed per NMJ chain). Statistical tests were performed using the student's t test (two-tailed distribution, unpaired). ***, P<0.001. Mean±s.e.m. are plotted.

