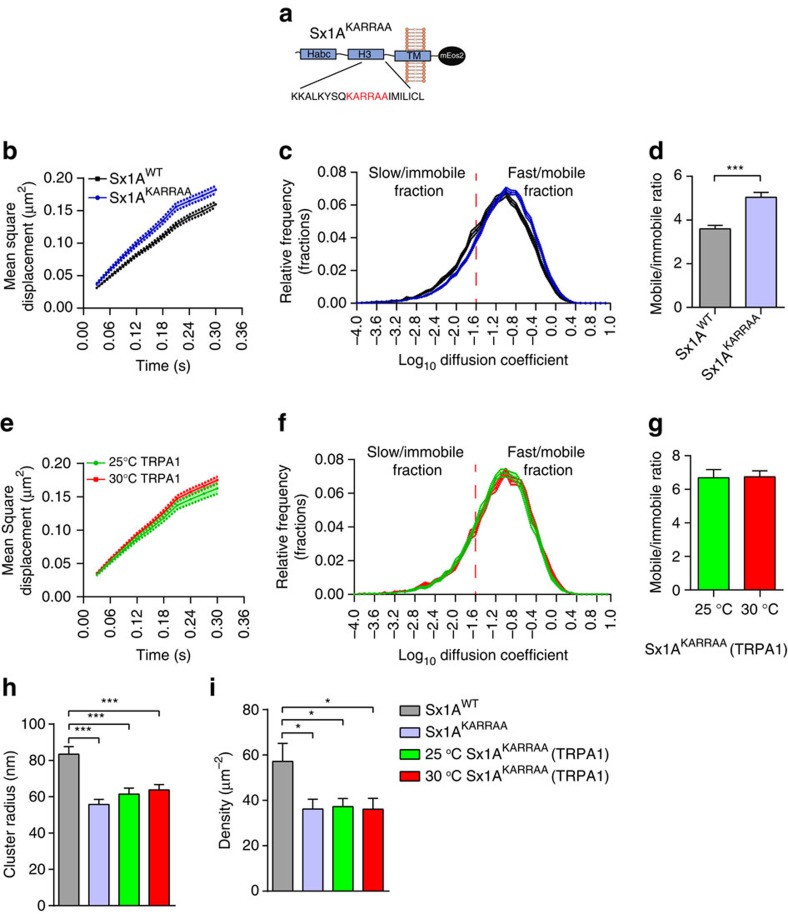
Figure 6. PtdIns(3,4,5)P3 interaction alters Sx1A mobility.
(a) Scheme illustrating the Sx1AKARRAA mutation that is known to exhibit reduced affinity to PtdIns(3,4,5)P3. The Sx1AKARRAA mutation was transgenically expressed in Drosophila and sptPALM was carried out on live motor nerve terminals. (b,c) Comparison of MSDs and diffusion coefficient distributions of Sx1A-mEos2 and Sx1AKARRAA-mEos2 (n=17 NMJ chains for Sx1A-mEos2 and 19 NMJ chains for Sx1AKARRAA-mEos2; average of ∼2,600 trajectories analysed per NMJ chain). (d) The mobile to immobile ratio was 3.6±0.2 for Sx1A-mEos2 and 5.0±0.2 for Sx1AKARRAA-mEos2. (e,f) Sx1AKARRAA-mEos2 or Sx1A-mEos2 larvae with concomitant dTRPA1 expression were heated from 25 to 30 °C to stimulate neurotransmitter release. Note that the MSD of Sx1AKARRAA-mEos2 was also not affected by stimulation. (g) The mobile to immobile ratio was not significantly altered: 6.7±0.5 at 25 °C to 6.7±0.3 at 30 °C (n=13 NMJ chains at 25 °C and 14 NMJ chains at 30 °C; average of ∼1,700 trajectories per NMJ chain). (h) Fixed larvae were analysed for SML. The average cluster radius of Sx1AKARRAA-mEos2 (55.8±2.7 nm) compared with Sx1A-mEos2 (83.5±4.2 nm) was significantly different. Expressing dTRPA1 (25 °C, 61.5±3.3 nm) or elevating the temperature did not significantly alter the cluster size (30 °C, 63.7±2.9 nm). (i) The Sx1AKARRAA-mEos2 average density was significantly lower (36.1±4.3 μm−2) than that of Sx1A-mEos2 (57.2±7.9 μm−2); this was unchanged by dTRPA1 expression (25 °C, 37.3±3.6/μm2) and stimulation (30 °C, 36.1±4.8 μm−2). Statistical tests were performed using Student’s t-test (two-tailed distribution, unpaired). *P<0.05, ***P<0.001. Mean±s.e.m. are plotted.

