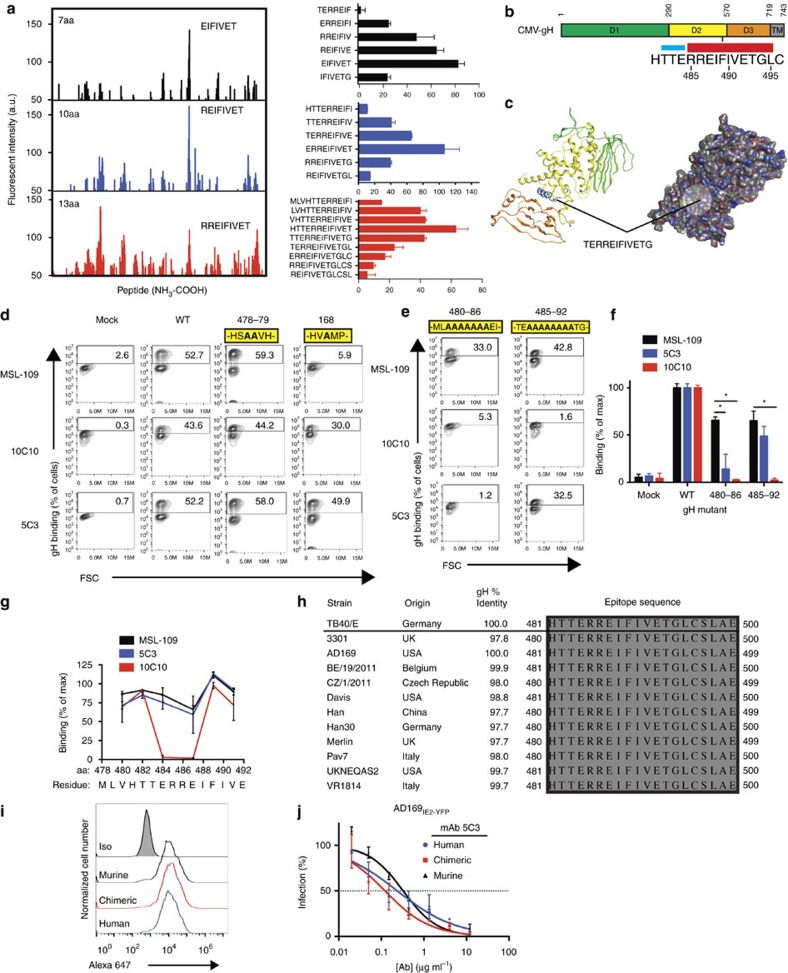
Figure 8. Characterization of the α-gH mAb epitopes.
(a) Spot intensities were quantified following incubation of 5C3 followed by anti-mouse Dylight680 mAb with overlapping conformational gH peptide libraries of 7 amino acids (aa; black), 10aa (blue) and 13aa (red; left panel). Reactivity of 5C3 with overlapping peptide series near the region of peak binding are shown (right panel). Data represents mean intensity from duplicate samples. (b) The region of 5C3 reactivity is located between aa's 481–495 within domain 2 of gH. The region includes a β-sheet (blue) and a 10aa-long alphahelical region (red). (c) Structural modeling of CMV-gH based on the crystal structure of HSV-1 indicates the location of the putative epitope (blue; left). Predicted surface interactions indicate that the 5C3-reactive alpha helical region is exposed on the surface of gH (circle; right). (d) 293 cells transfected with gL and a transfection control, wild-type gH, gH mutant 478–79 or gH mutant 168 were stained with MSL-109 (top row), 10C10 (middle row) or 5C3 (bottom row). Percentage of cells positive for gH are indicated. (e) 293 cells transfected with gL and gH mutant 480–86 or 485–92 were stained with MSL-109 (top row), 10C10 (middle row) or 5C3 (bottom row). Percentage of cells positive for gH are indicated. (f) The data from Fig. 6e was quantified and normalized compared with WT binding. (g) Binding of MSL-109 (black), 5C3 (blue) and 10C10 (red) to 293 cells transfected with gH containing 2aa alanine substitutions along the length of the epitope region was measured. Percentage of gH-positive cells compared with WT-transfected cells was calculated and plotted. (h) The epitope region from 12 geographically distinct CMV strains were aligned to the TB40/E sequence. (i) U373gH/gL cells were exposed to murine, chimeric and humanized 5C3 mAbs and analyzed by flow cytometry with cells exposed to an isotype control (grey peak). (j) Murine, chimeric and humanized 5C3 mAbs were pre-incubated with AD169IE2-YFP at various concentrations before exposure to MRC5 fibroblasts. Infection levels were measured and compared with an isotype control. Data in d–g, i, j represents duplicates from three experiments. S.d. is depicted in all relevant figures. *P<0.05 (Student's two-tailed t test).

