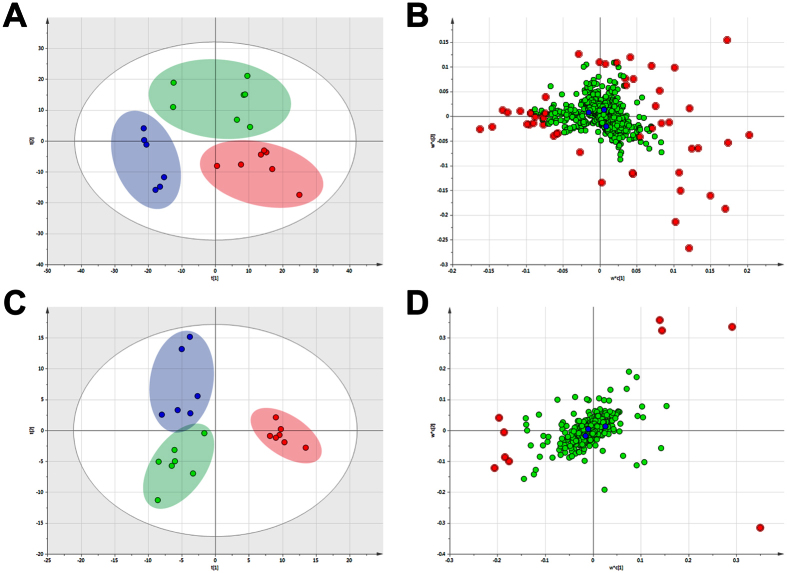
Figure 4. PLS-DA score plot and its corresponding loading plot based on UPLC-MS profiling data of serum samples.
(A) PLS-DA score plot in control group ( ), tumor model group (
 ) and FAE treatment group (
 ) detected in positive ion mode, with fitting and predictive performance (3 latent variables, R2X = 0.478, R2Y = 0.825, Q2 = 0.36). (B) Loading plot in three groups detected in positive ion mode. (C) PLS-DA score plot in control, tumor model and FAE treatment groups detected in negative ion mode, with fitting and predictive performance (2 latent variables, R2X = 0.248, R2Y = 0.808, Q2 = 0.313). (D) Loading plot in three groups detected in negative ion mode. The variables with VIP >3.0 were highlighted with red filled circle (
 ).
).

