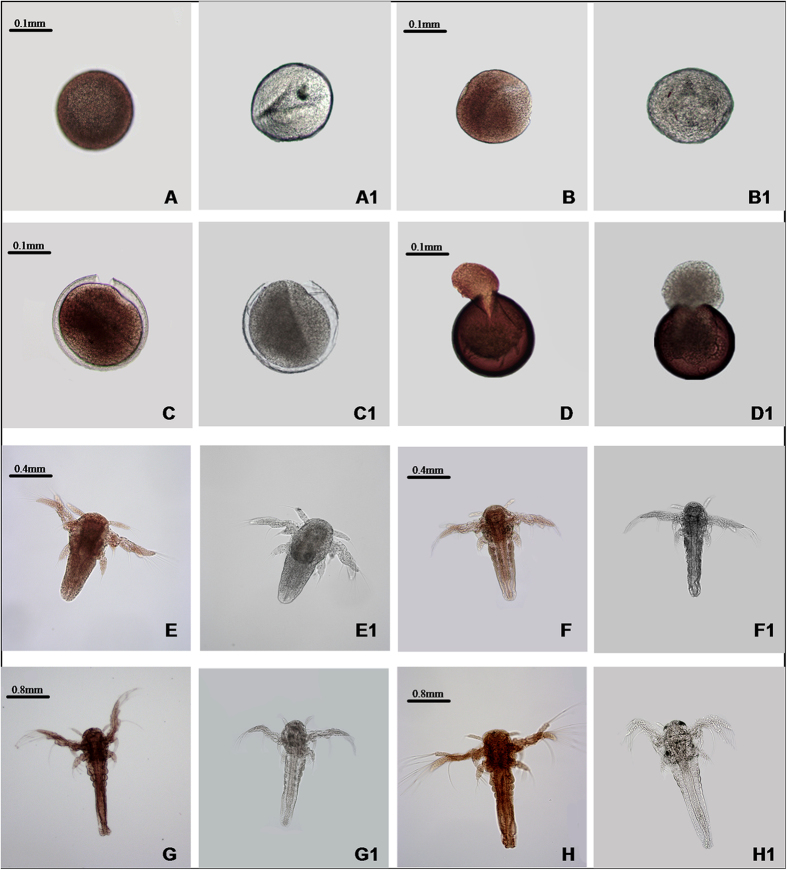
Figure 5. The whole mount immunohistochemical analysis of As-CDH1 expression during different developmental stages in A. sinica.
(A–H) represent the experimental groups; A1–H1 represent the control group. (A) gastrula stage (0 h); (B,C,D) embryonic stage (5 h, 10 h and 15 h); (E,F) nauplius stage (20 h and 40 h); (G,H) metanauplius stage (3 and 7 days).

