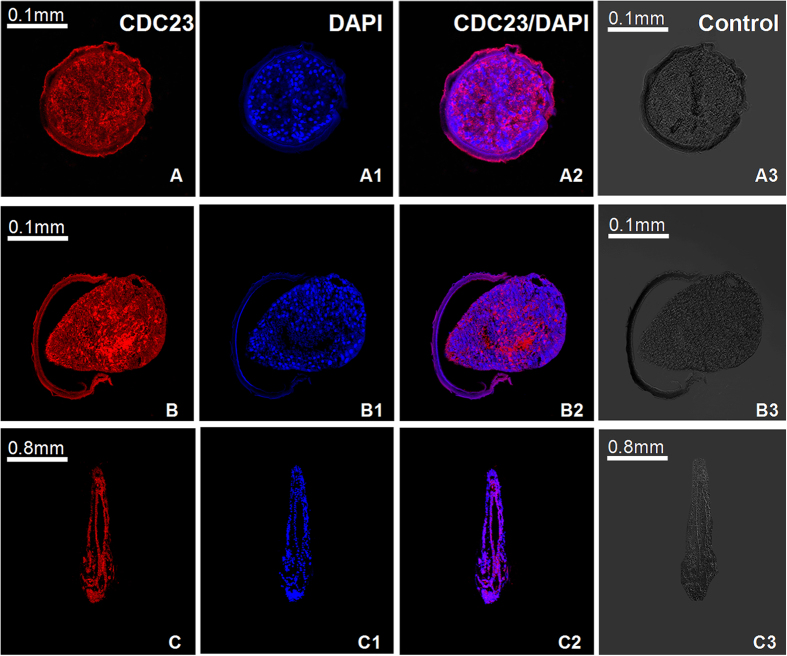
Figure 6. Immunolocalization analysis of As-CDC23 at the embryo and sub-adult stages in A. sinica.
A-A3: 0 h; B-B3: 15 h; C-C3: 3d; (A–C) represent anti-CDC23-label; A1-C1: single-labeling with DAPI; A2-C2 represent the image overlay of the samples dual-labeled with polyclonal anti-CDC23 and DAPI. A3-C3 represent control group.

