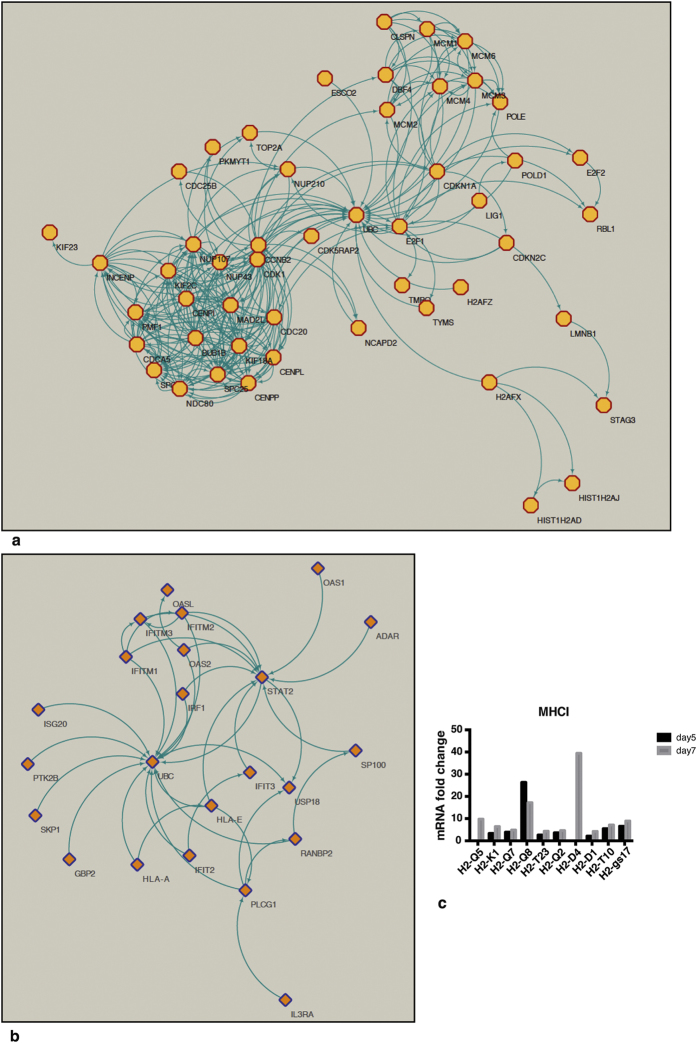
Figure 2. Pathways enrichment reveals activation of cell cycle at d5 and Type I IFN downstream regulation at d7.
Pathway mapping were realised using REACTOME and showed by Cytoscape. The network among DE genes at the two time points was showed for “cell proliferation” at d5 (a) and “immune response by Type IFN” at d7 (b). The blue arrows represent molecular relationship, while the yellow dots represent DE transcripts involved in the networks (c) MHC class I DE genes has been displayed as fold change in the infected mice at the two time points compared to their infected control.

