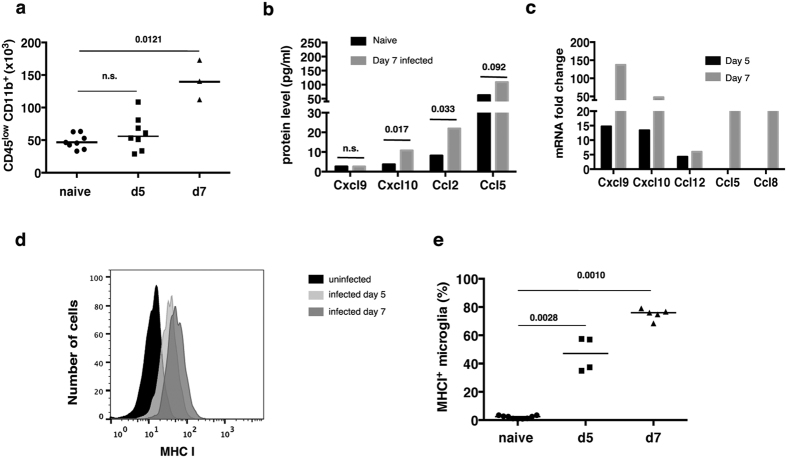
Figure 3. Validation of microarray analysis.
(a) Number of microglia isolated from naïve mice and infected mice at 5 and 7 days post infection from entire brains. Each dot represents a single mouse and the lines define the median. Statistical analysis was performed by Mann-Whitney test, the number over the bar indicates the p value. (b) Differentially expressed chemokines in infected mice at day 5 and 7 post infection determined from the microarray analysis. (c) Chemokines in the supernatant of microglia was isolated from mice that had reached the humane endpoint 7 days post infection compared with the levels in uninfected mice. Results are expressed as median, n = 7 replicates for 3 separate experiments Statistical analysis was performed using Mann-Whitney test; the number over the bar represents the p value. (d) Flow cytometry: histograms showing the level of expression of MHC class I molecules on the surface of microglia from naïve mice, and from mice infected with PbA for 5 or 7 days. (e) Percentage of MHC class I positive microglia in the brains at day 5 and day 7 post infection of infected mice compared with uninfected naïve mice. Each dot represents a single mouse and the lines define the median. Statistical analysis was performed by Mann-Whitney test, the number over the bar indicates the p value, n.s. stand for non significant and indicates p > 0.05.

