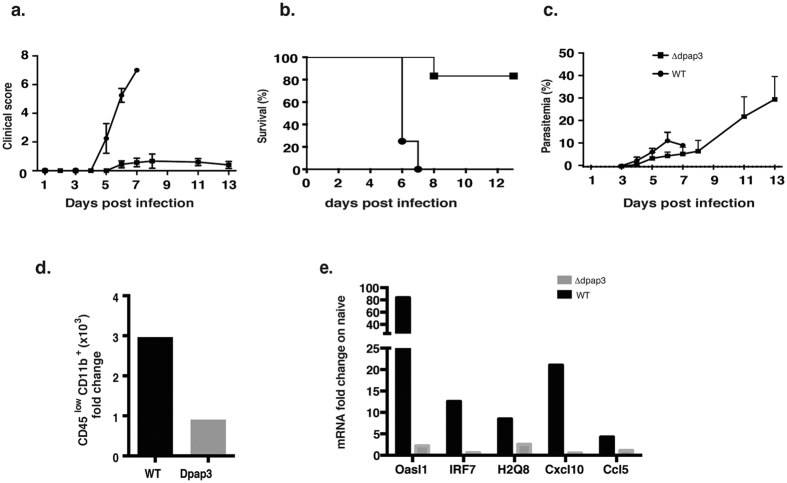
Figure 4. C57BL/6 mice were infected with 105 DPAP3KO iRBC.
(a) Clinical score of the mice was calculated as the sum of several neurological signs and phenotypic features. Survival (b) and parasitemia (c) were monitored daily from d3. Results are represented as mean ± SD, n = 5. (d) Microglia cell count of sorted cells reveals significant difference in PbA infected mice showing ECM 7 days post infection compared to uninfected mice, on the contrary non-ECM mice infected with ΔDPAP3 have no difference. Statistical analysis was performed by Mann-Whitney test, the number over the column indicates the p value. N.s. stand for non significant and indicates p > 0.05. (e) mRNA fold change of several genes involved in the Type I IFN response revealed by real time PCR. At d7 microglia from non-ECM mice infected with ΔDPAP3 parasites have a lower fold change compared to the ECM mice at the same time point. Results are expressed as mean (n = 5).

