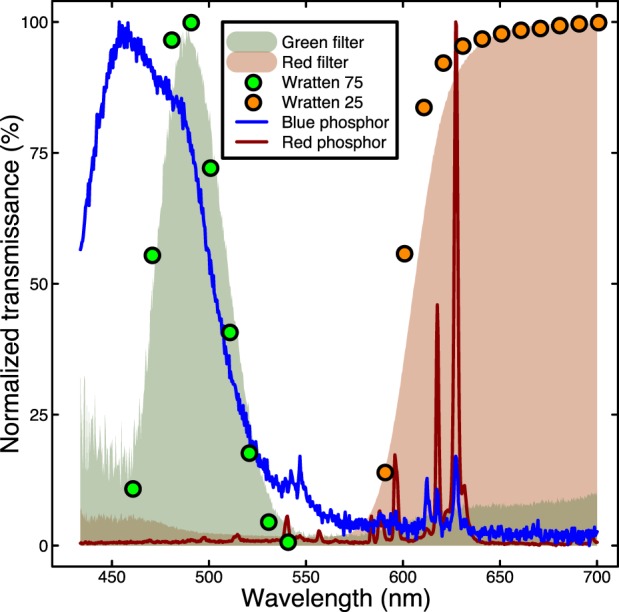
Figure 1.

Properties of anaglyph filters and monitor phosphors, measured using a spectroradiometer. The shaded regions show the transmittances of red and green Wratten filters, which correspond well to published values (circles). The lines show the spectral properties of the blue and red phosphors of the Iiyama VisionMaster Pro monitor.
