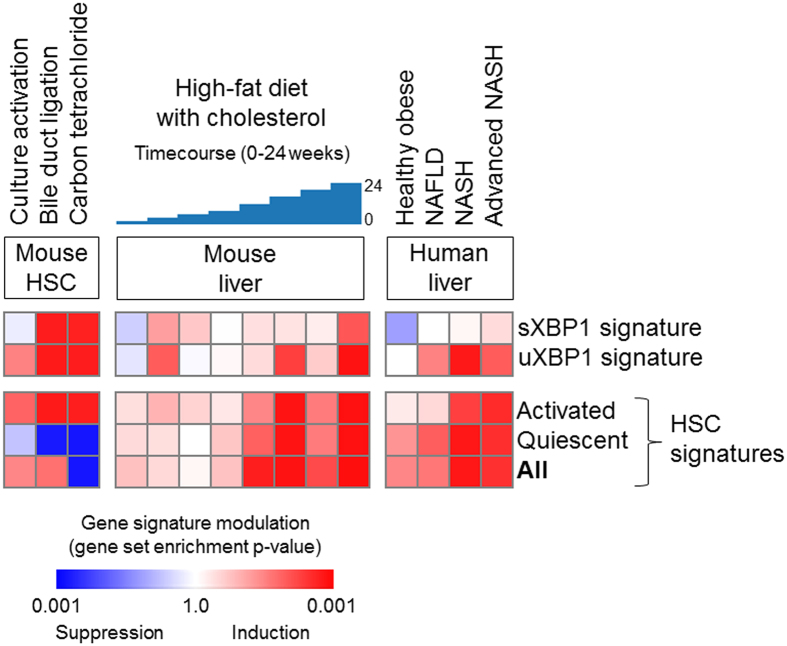
Figure 5.
Significant co-induction of the XBP1 gene signatures and HSC gene signatures is seen with the progression of murine and human liver disease, specifically in (A) ex vivo culture-activated or in vivo activated mouse primary HSCs (NCBI Gene Expression Omnibus, GSE34640 with n = 3–5 per group), (B) liver tissues of time-course high-fat with cholesterol diet-treated NAFLD mouse model (GSE40481 with n = 3 per group), and (C) liver tissues of NAFLD patients according to the disease stages (simple steatosis, steatohepatitis, severe fibrosis (GSE49541 with n = 72, GSE61260 with n = 134), assessed by Gene Set Enrichment Analysis33. The heatmap indicates gene set enrichment p-values for each gene signature. The pattern of the XBP1 gene signature induction is tightly correlated with that of the HSC activation signature (p = 0.01 for sXBP1 signature and p < 0.001 for uXBP1 gene signature, Pearson correlation test).

