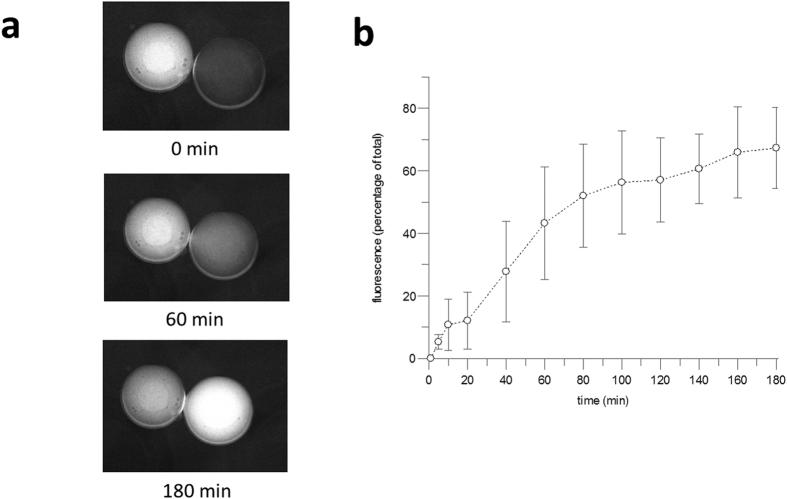
Figure 5. In situ cell-free expression and activity of LacY in 25:50:25 DOPC:DOPE:DOPG lipids.
(a) Images taken of a DIB at 0 mins. 60 mins and 180 mins are shown. (b) MUG transported across the bilayer interface expressed as the percentage of fluorescence in the acceptor droplet. Errors are ± SD of n ≥ 3.

