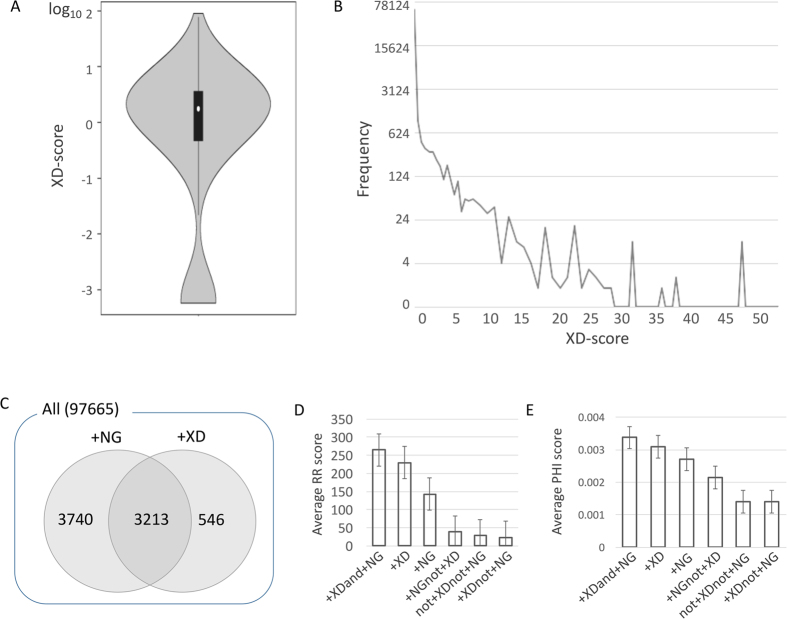
Figure 2. Statistics of comorbidity measures for disease pairs in the US Medicare data.
(A) The distribution of the log-scaled XD scores. (B) The distribution of the positive XD scores. (C) The numbers of disease pairs chosen by different quantities (+NG: disease pairs having at least one common gene, +XD: disease pairs having the positive XD scores). (D) The average and standard errors of RR scores of disease pairs chosen by different quantities. (E) The average and standard errors of PHI scores of disease pairs chosen by different quantities. (+XDand + NG: disease pairs having both the positive XD scores and at least one common gene, +NGnot + XD: disease pairs having at least one common gene but without the positive XD scores, +XDnot + NG: disease pairs having the positive XD scores but without sharing genes, and not + XDnot + NG: disease pairs having the negative or zero XD scores without sharing any gene).

