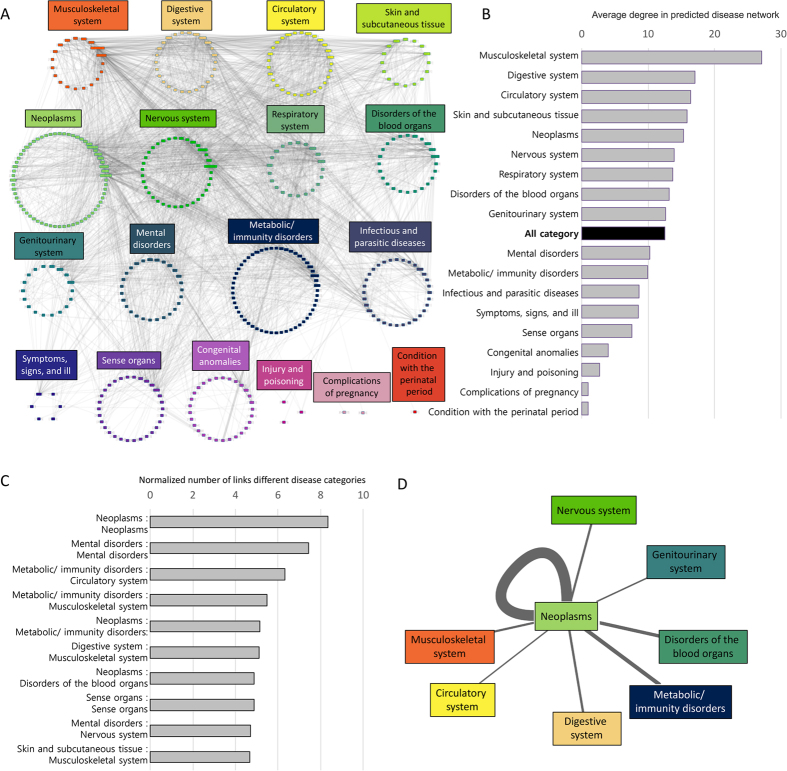
Figure 3. Construction of the predicted disease network based on XD score.
(A) The top 10% of disease pairs having the highest XD score. The color of nodes indicates a disease category based on ICD-9 classification (Supplementary Table 3). (B) Average degree (number of links with other diseases) of diseases in the disease category. The average degree of all diseases in the disease network is 12.543 (marked as a black bar). Musculoskeletal system had the highest average degree, indicating that musculoskeletal system related diseases often accompany other diseases as complications or are frequently accompanied by other diseases as complications. (C) Top-ranked disease category pairs based on the normalized number of links between disease categories (including links between different disease category pairs as well as links within one disease category). Note that diseases in the neoplasm category have the highest intra-comorbidity patterns. (D) Illustration of distinct comorbidity patterns around the neoplasm category. The edge thickness represents the relative degree of the XD score between two disease categories.

