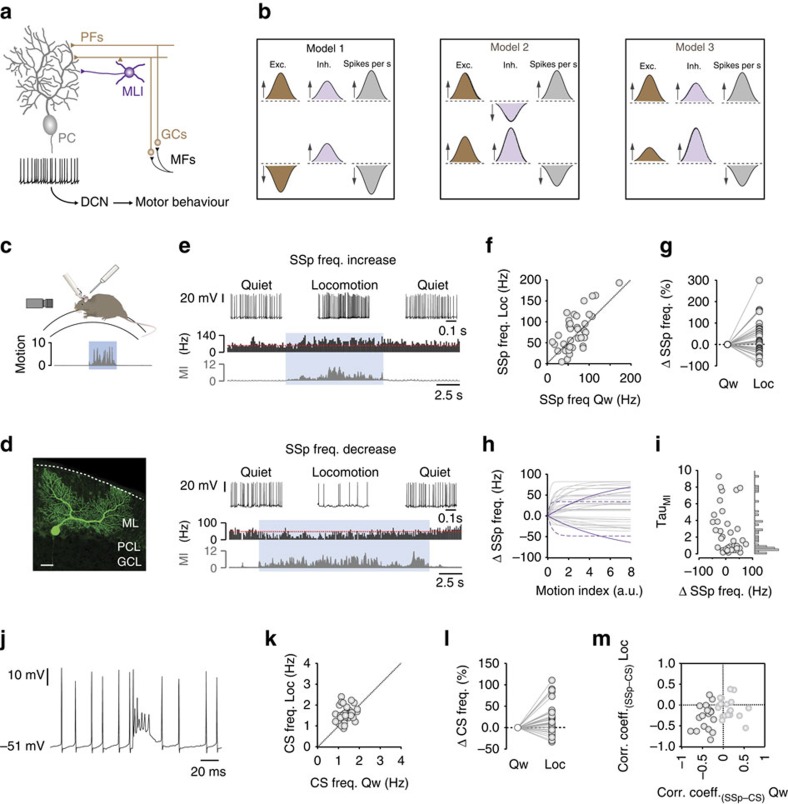
Figure 1. Bidirectional Purkinje cell SSp modulation during locomotion.
(a) Schematic showing feedforward circuitry of the cerebellum. DCN, deep cerebellar nuclei; GCs, granule cells; PC, Purkinje cell; PFs, parallel fibres; MFs, mossy fibres. (b) Feedforward input models underpinning locomotion-dependent bidirectional PC simple spike (SSp) modulation. exc, excitation; freq., frequency; inh, inhibition. (c) Recording configuration in awake mice where locomotion was captured using digital video. (d) Intracellular biocytin labelling of a PC via the recording electrode. Scale bar, 30 μm. GCL, granule cell layer; PCL, Purkinje cell layer; ML, molecular layer. (e) Somatic voltage recordings, spike rate histograms and associated motion index values (MI; dark grey) from two PCs during quiet wakefulness and voluntary locomotion (blue). Dashed red line denotes average firing rate during quiet wakefulness. (f) Purkinje cell quiet wakefulness SSp firing rate (Qw) as a function of locomotion-related SSp firing rate (Loc, n=38 cells, N=33 mice). Symbols represent individual PCs and dotted line represents unity. (g) Average change in PC SSp firing rate during quiet wakefulness (Qw) and locomotion (Loc; n=38 cells, N=33 mice). (h) Average change in PC SSp firing rate as a function of increasing movement. Grey lines represent exponential fits to the data in individual cells, solid purple lines represent PCs that increase/decrease their firing rates relative to the magnitude of movement and dashed purple lines represent PCs that are highly sensitive only to small movements (n=38 cells, N=33 mice). a.u., arbitrary units. (i) Distribution of TauMI values taken from the exponential fits shown in h. (j) Representative example of a climbing fibre-mediated complex spike (CS). (k) Purkinje cell quiet wakefulness (Qw) CS firing rate as a function of locomotion-related CS firing rate (n=38 cells, N=33 mice). Symbols represent individual PCs and dotted line represents unity. (l) Average change in PC CS firing rate during quiet wakefulness (Qw) and locomotion (Loc; n=38 cells, N=33 mice). (m) Distribution of CS versus SSp firing rate correlation coefficients during quiet wakefulness (Qw) and locomotion (Loc). Black circles denote PCs that displayed reciprocal firing rates during quiet wakefulness or locomotion (n=18/38 cells, N=33 mice).

