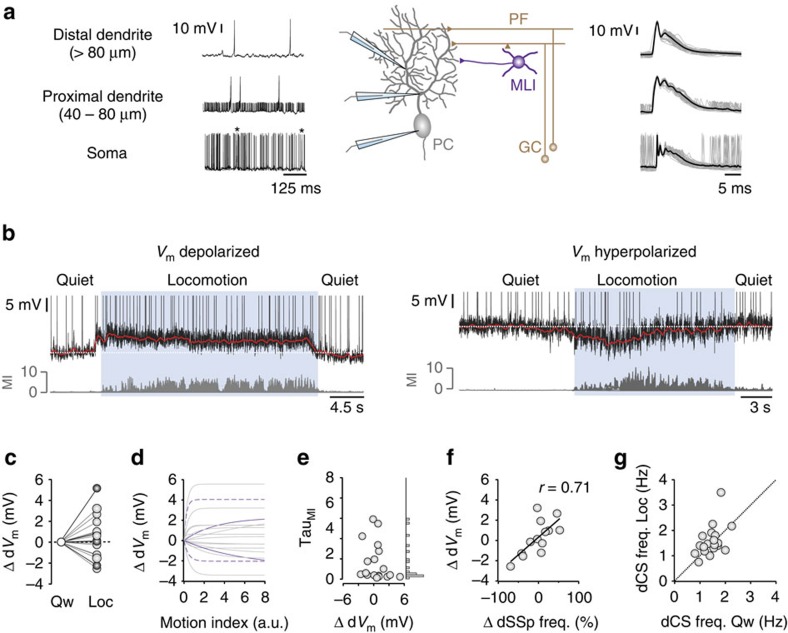
Figure 2. Purkinje cell dVm changes during locomotion.
(a) Schematic showing PC recording configurations (GC, granule cell; MLI, molecular layer interneuron; PC, Purkinje cell; PF, parallel fibre) and representative somatic (lower trace), proximal dendritic (middle trace, ∼60 μm from soma) and distal dendritic (upper trace, ∼100 μm from soma) voltage recordings from three PCs in vivo. Asterisks denote complex spikes. Right—dendritic calcium spike waveforms (50 consecutive traces overlaid (grey) and average Vm (black)). (b) Representative dendritic voltage recordings from two different PCs that depolarize (upper trace) or hyperpolarize (lower trace) during self-paced locomotion (blue shading). Motion index (MI, grey) defines the magnitude and duration of each locomotion bout. Note dendritic calcium spikes have been truncated to improve visualization of dendritic Vm (dVm) changes. Red lines depict smoothed average Vm. (c) Average PC dVm changes (ΔdVm) during self-paced locomotion (n=19 cells, N=17 mice). Black filled circles depict dVm changes in distal dendritic recordings (n=6 cells) and grey symbols depict dVm changes in proximal dendritic recordings (n=13 cells). (d) Average change in dVm (ΔdVm) as a function of increasing movement (MI). Grey lines represent exponential fits to the data in individual cells, solid purple lines represent examples of dVm changes that are relative to the magnitude of movement and dashed purple lines represent cells that are highly sensitive to small movements associated with movement preparation or initiation (n=19 cells, N=17 mice). a.u., arbitrary units. (e) Distribution of TauMI values taken from the exponential fits shown in d. (f) Relationship between ΔdVm and percentage change in dSSp firing rate during self-paced, locomotion (n=13 cells, N=11 mice). Filled symbols represent the data from individual PCs and the solid line is a linear fit to the data r=0.71, P<0.01. (g) Average dendritic calcium spike frequency during quiet wakefulness and locomotion (n=19 cells, N=17 mice). Filled circles represent individual cells and dotted line represents unity.

