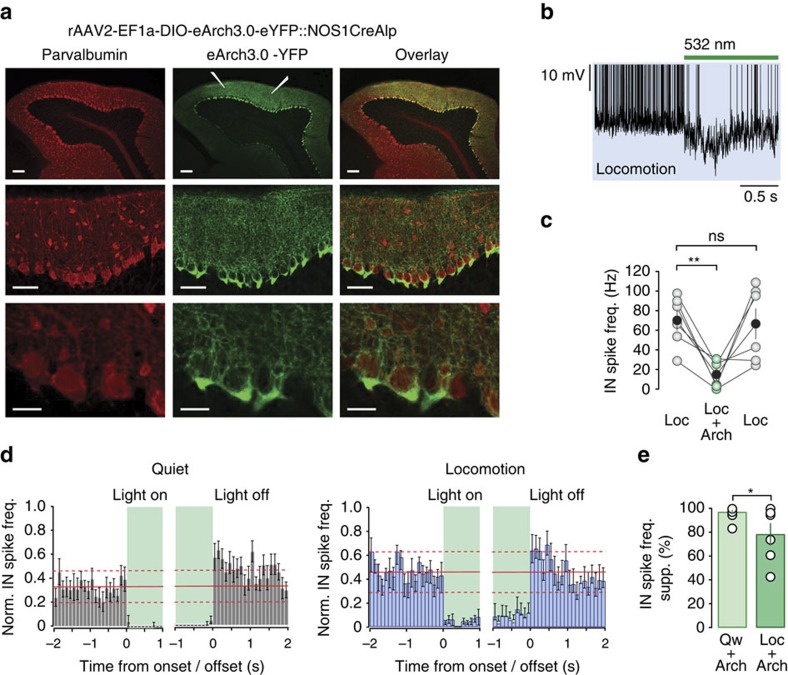
Figure 4. Arch 3.0-mediated silencing of molecular layer interneurons.
(a) Low- and higher-magnification confocal images of parvalbumin (PV, red) and eArch3.0-eYFP labelling (green) along the apex of lobule V of the cerebellar vermis. Parasagittal sections of lobule V (upper panel, scale bar, 100 μm) were cut 9 days post virus injection. Two injections (white electrodes, middle panel) were performed at anterior and posterior locations in the craniotomy to ensure maximal viral infection across lobule V. Lower panels—higher-magnification images of lobule V highlighting the cell-selective expression of Arch 3.0 in MLIs (middle panels, scale bar, 50 μm; bottom panels, scale bar, 20 μm). (b) Example of light-evoked silencing of a MLI (green bar, 2 s pulse of 532 nm light) during locomotion (blue shading). Note spikes have been truncated to improve visualization of the photo-induced hyperpolarization. (c) Average firing rate of MLIs during locomotion (Loc), locomotion plus light activation (Loc+Arch) and after cessation of the light stimulus (Loc). Grey and green symbols and connecting lines represent the data from individual MLIs, and black symbols represent mean±s.e.m.**P<0.01, ns, not significant, two-tailed t-tests (n=6 cells, N=6 mice). (d) Normalized MLI firing frequency histogram (bin size=100 ms) aligned to the onset and offset of 532 nm light stimulation (green shading) during quiet wakefulness (grey left hand panels, n=9 cells, N=8 mice) and locomotion (blue right hand panels, n=6 cells, N=6 mice). Solid red line depicts the mean frequency before light stimulation and dashed lines indicate 2 × s.d. of the mean. (e) Mean percentage suppression of MLI firing frequency after Arch 3.0 stimulation during quiet wakefulness (Qw+Arch, n=9, N=8 mice) and locomotion (Loc+Arch, n=6, N=6 mice). Open circles represent the data from individual MLIs and bars represent mean±s.e.m., *P<0.05, two-tailed t-test. freq., frequency; Norm., normalization; supp., suppression.

