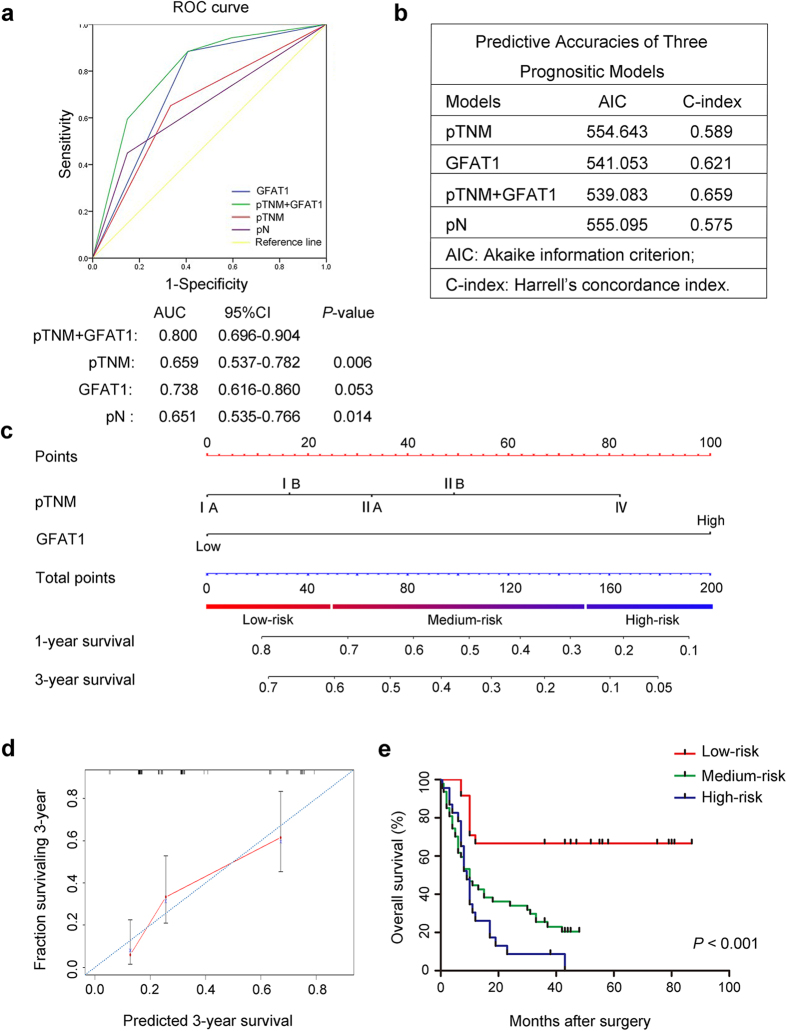
Figure 3. Combination of GFAT1 expression with pTNM stage generates a better predictive model for overall survival of pancreatic cancer patients (n = 96).
(a) ROC curve analysis of the sensitivity and specificity of the predictive value of the pTNM stage model, GFAT1 model, the combined model and lymph node metastasis (pN) model. (b) AIC and Harrell’s C-index analysis of the comparison of the predictive accuracies of pTNM staging, pN and GFAT1 expression. (c) Nomogram for predicting clinical outcomes integrated GFAT1 expression (Low/High) with pTNM classification (IA, IB, IIA, IIB, IV). In the nomogram, higher total point predicts worse prognosis. Addition of pTNM classification (0 for “IA”, 16 for “IB”, 33 for “IIA”, 49 for “IIB” or 82 for “IV”) and GFAT1 expression (0 for “Low” or 100 for “High”) for each patient correspondingly gives the total point. (d) Calibration plot for nomogram predicted and observed 3-year survival rate. Calibration curves for nomogram predicted 3-year overall survival performed well with the ideal model. Line of dashes: ideal model; vertical bars, 95% confident interval. (e) Kaplan–Meier curves of overall survival based on risk score calculated by nomogram. P-value was assessed by log-rank test.

