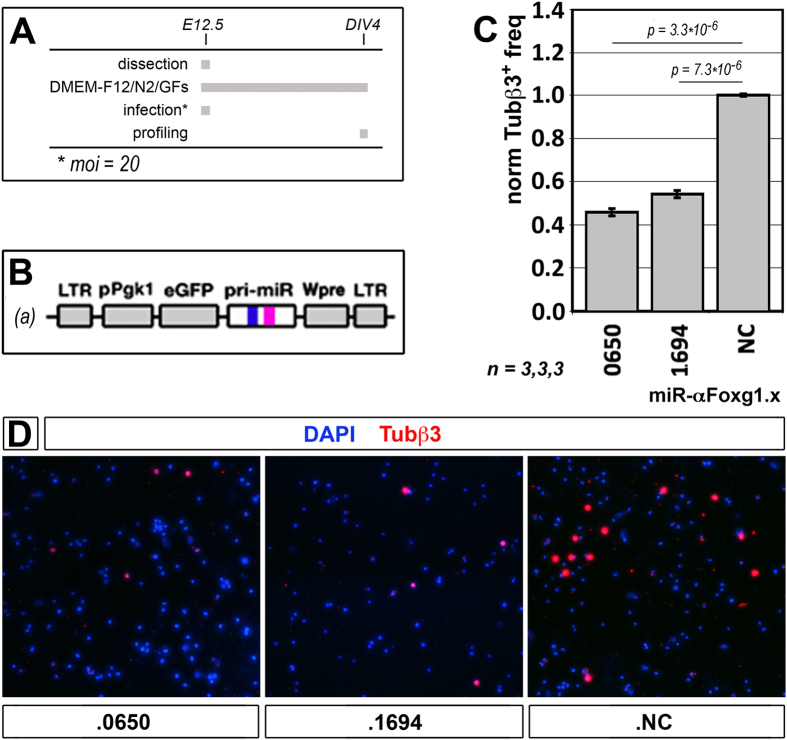
Figure 2. Histogenetic outcome of Foxg1-RNAa.
(A,B) Protocols and lentiviral reagents employed for this assay. (C) Quantification of cells immunopositive for the neuron-specific Tubβ3 marker, in cultures of neocortical precursors expressing Foxg1-saRNAs. (D) Examples of Tubβ3+ immuno-fluorescences referred to in (C). E, embryonic day. DIV, days in vitro. Bars represent sem’s. n = number of biological replicates. Statistical significance of results evaluated by t-Student assay (one-tail, unpaired). Absolute average frequency of Tubβ3+ cells in NC samples was (27.25 ± 0.16)%.

