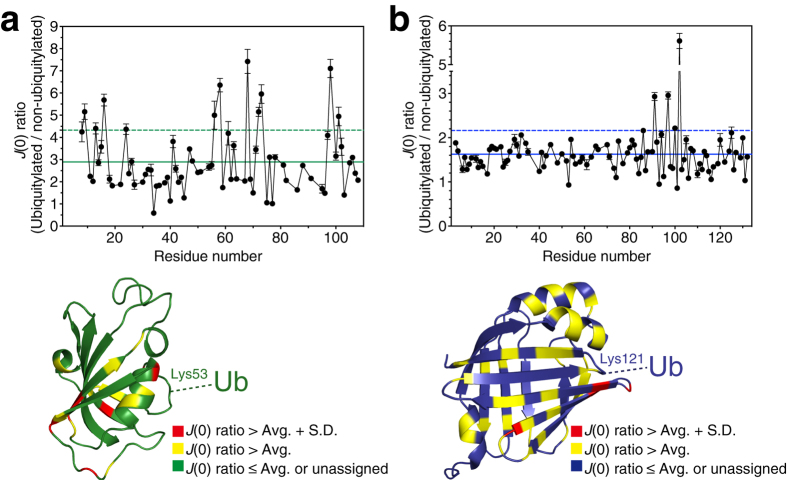
Figure 4. Increased in structural fluctuations in substrate proteins due to ubiquitylation.
Upper, spectral density function J(0) ratio of the ubiquitylated to the non-ubiquitylated form of FKBP12 (a) and FABP4 (b). Solid and dashed lines indicate the average and standard deviation of the J(0) ratio, respectively. Lower, mapping of the J(0) ratio onto the individual structures (PDB database accession codes: 2PPN for FKBP1229 and 3RZY for FABP4)30. The respective ubiquitylation site is indicated.

