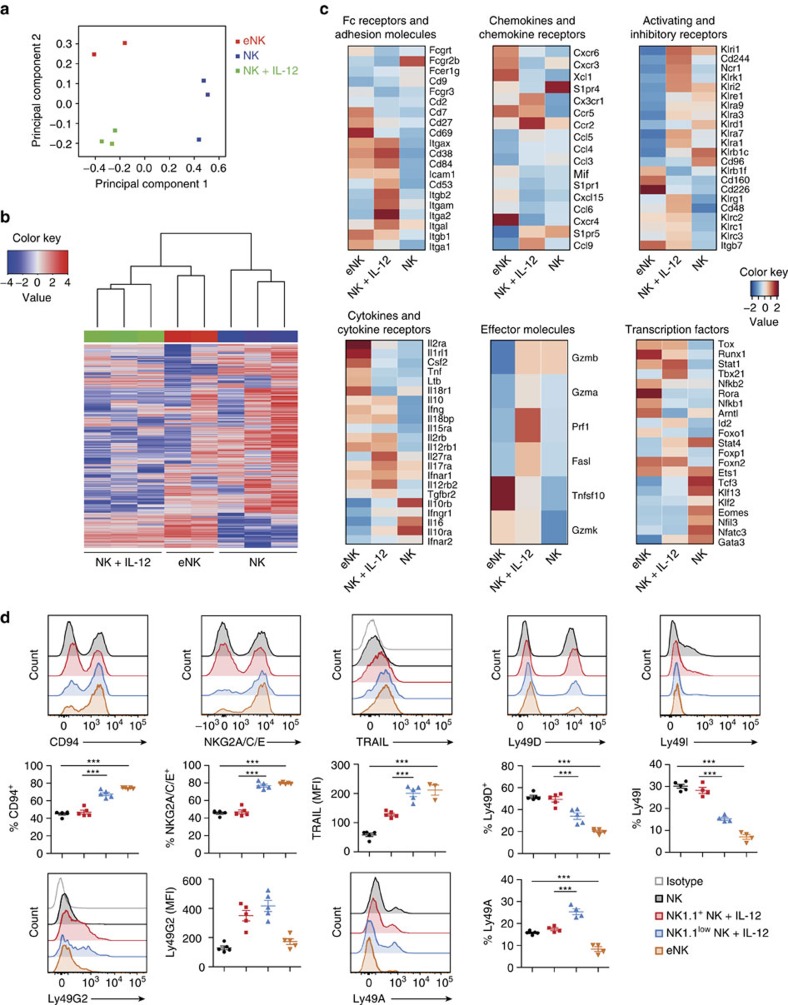
Figure 3. Spectrum of distinct and shared genes among different NK-cell subsets.
(a) PCA of gene expression by sorted CD122+CD49b+ cells obtained from WT mice treated with IL-12 (NK+IL-12) or Ctrl (NK) and from IL-12-treated Rag2−/−Il2rg−/− mice (eNK). (b) Hierarchical clustering of gene expression by sorted NK+IL-12, eNK and NK cells. (c) Heat maps showing differentially expressed genes by sorted eNK, NK+IL-12 and NK cells, clustered to their indicated categories. Heat maps show representative data from one sample from each group. See also Supplementary Table 1 for detailed expression levels and significance. (d) Representative histograms and quantification of CD94, NKG2A/C/E, TRAIL, LY49D, Ly49I, Ly49G2 and Ly49A expression on lung NK, NK1.1+ versus NK1.1low NK+IL-12 and eNK cells. Two independent experiments were performed with at least 3–5 mice per group. Data are expressed as mean±s.e.m. One-way analysis of variance was used to determine significance (***P<0.001). PCA, principal component analyses.

