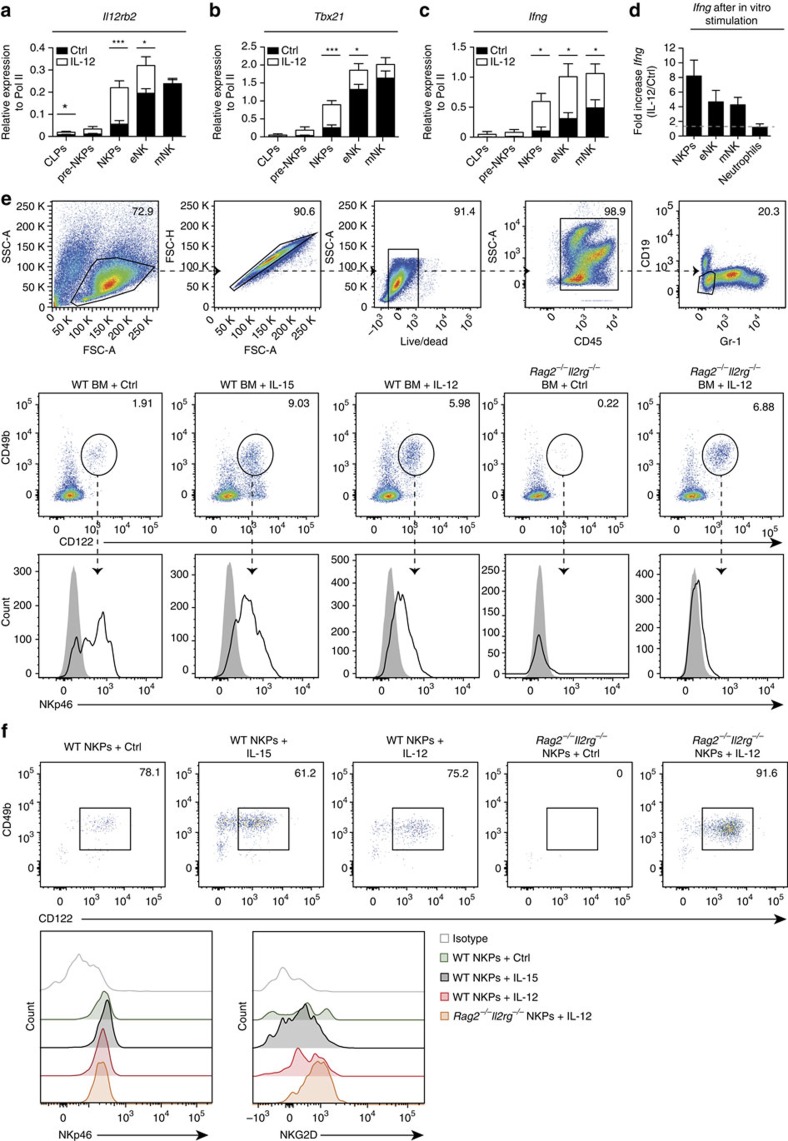
Figure 5. Il12rb2-expressing NKPs respond to stimulation with IL-12 and differentiate into eNK cells.
CLPs, pre-NKPs, NKPs, eNK and mNK cells were isolated from BM of Ctrl- or IL-12-treated mice and mRNA expression levels of (a) Il12rb2, (b) Tbx21 and (c) Ifng were quantified by quantitative reverse transcription PCR (qRT–PCR). Data are shown as pooled samples from three to five mice per group for three independent experiments. (d) NKPs, eNK and mNK cells were sorted from WT mice and were treated for 6 h with IL-12 or Ctrl. Ifng expression levels were quantified by qRT–PCR. Neutrophils were used as a negative control. Data are shown as pooled samples from three to five mice per group for three independent experiments. (e) BM or (f) NKPs from WT or Rag2−/−Il2rg−/− mice were purified and cultured with OP9 stromal cells with Ctrl, with IL-15 or with IL-12 for 4 days before being analysed for differentiation to NK cells. Expression of NKp46 and NKG2D is shown. Data are representative of two independent experiments. Data are expressed as mean±s.e.m. (*P<0.05, ***P<0.001, unpaired Student's t-test with or without Welch's correction).

