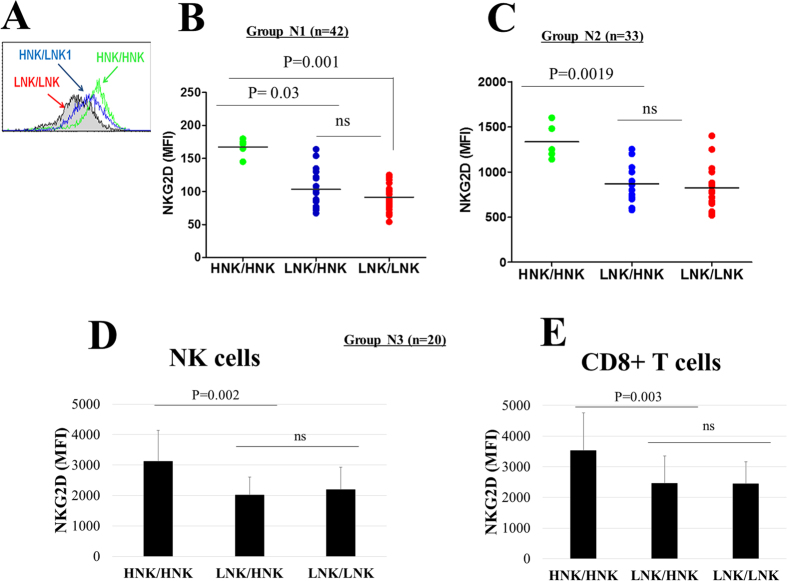
Figure 1. Association between NKG2D genotypes and NKG2D expression on NK cells.
(A) Representative flow cytometry histogram indicating higher NKG2D expression in NK cells with the HNK/HNK genotype. (B) Freshly isolated NK cells from a cohort of 42 healthy Japanese individuals with HNK/HNK (n = 4), LNK/HNK (n = 21) and LNK/LNK (n = 17) genotypes were examined for NKG2D expression at the cell surface by flow cytometry. (C) NK samples derived from a cohort of 33 healthy Japanese individuals were assessed for NKG2D expression as in B. The NKG2D expression in NK cells (D) and CD8+ T cells (E) in a cohort of 20 Vietnamese healthy individuals was assessed by flow cytometry. The MFI values for NKG2D expression are indicated in (B,C,D and E) with each dot representing one individual.

