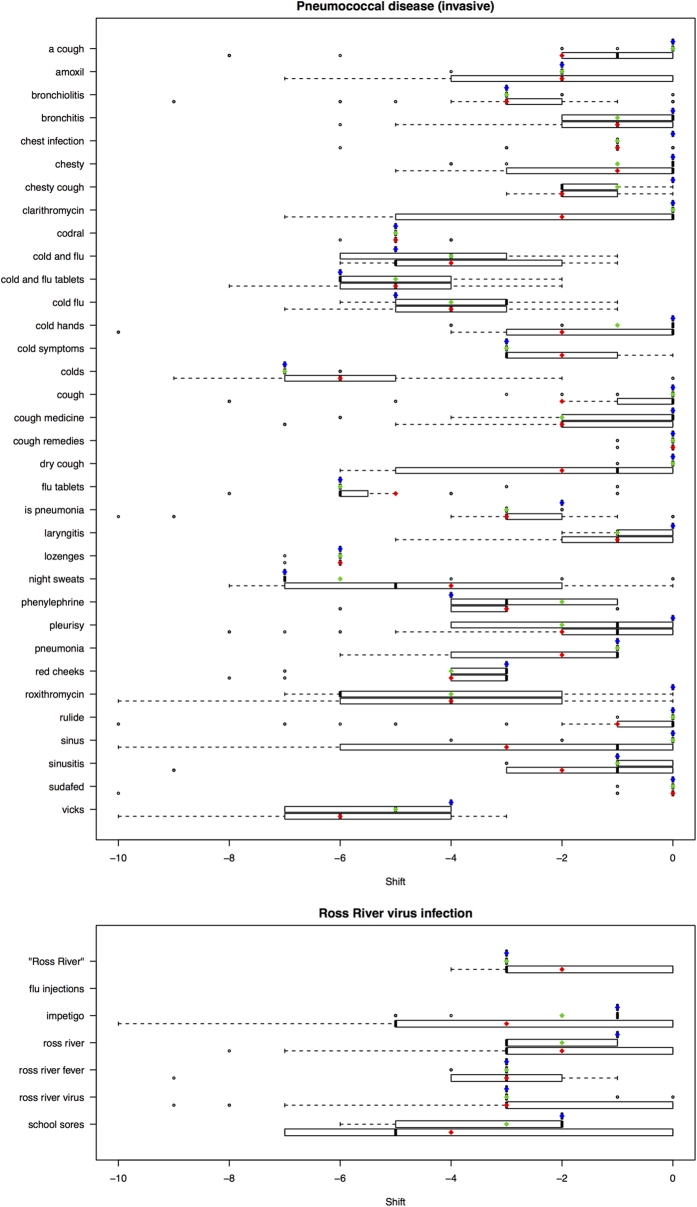
Figure 1. Boxplots of cross-correlation results for search terms and pneumococcal disease or Ross River virus infection.
Cross-correlations were estimated using a shifting 52 or 104-week window over a 156 week (2009–11) period or for the entirety of the 156-week period. Red, green and blue dots indicate the mean best cross correlation for the 52, 104 and 156-week period respectively; dark lines indicate the median.

