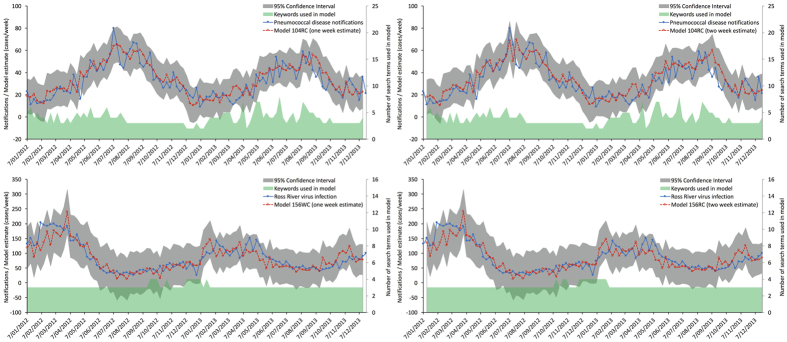
Figure 2. One (left) and two (right) week models for pneumococcal disease (top) and Ross River virus infection (bottom).
Solid blue line indicates notifications; broken red line indicates the model estimate; grey shading indicates the 95% confidence interval; and the green shading at the bottom indicates the number of keywords used in the model to create the estimate.

