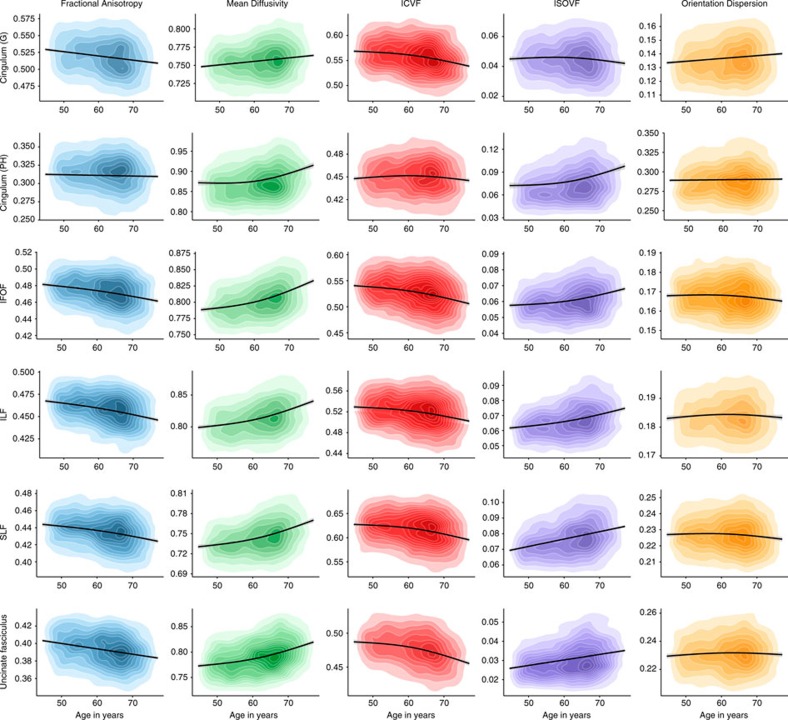
Figure 2. Age associations with the microstructural characteristics of association fibres.
(a) Kernel density plots indicate the degree of data point overlap (darker=greater); black line denotes the linear or quadratic regression line (with grey 95% CIs) across the five microstructural measures. Blue, FA; green, MD; red, intracellular volume fraction; purple, ISOVF; orange, OD. G, gyrus; IFOF: inferior fronto-occipital fasciculus; ILF, inferior longitudinal fasciculus; PH, parahippocampal; SLF, superior longitudinal fasciculus.

