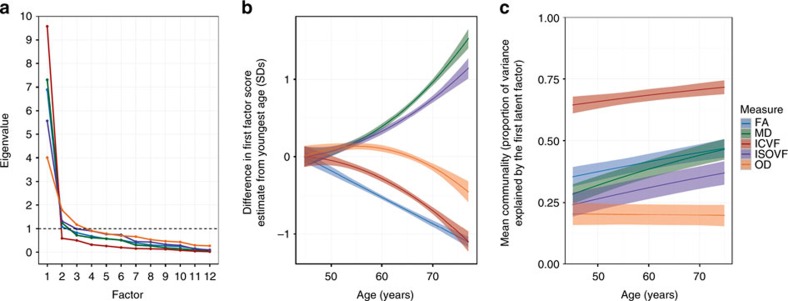
Figure 8. General factors of white matter microstructure explain greater variance with increasing age.
(a) Scree slopes for the exploratory factor analysis, showing the eigenvalue against the number of factors for each white matter tract measurement. (b) Age trajectories of the first (latent) factor of white matter microstructure for each of the five dMRI biomarkers. (c) Age de-differentiation of white matter microstructure. Age trajectories for the proportion of total variance in each tract measurement explained by the general factor. The shaded region around each trajectory shows ±1 s.d. of the mean.

