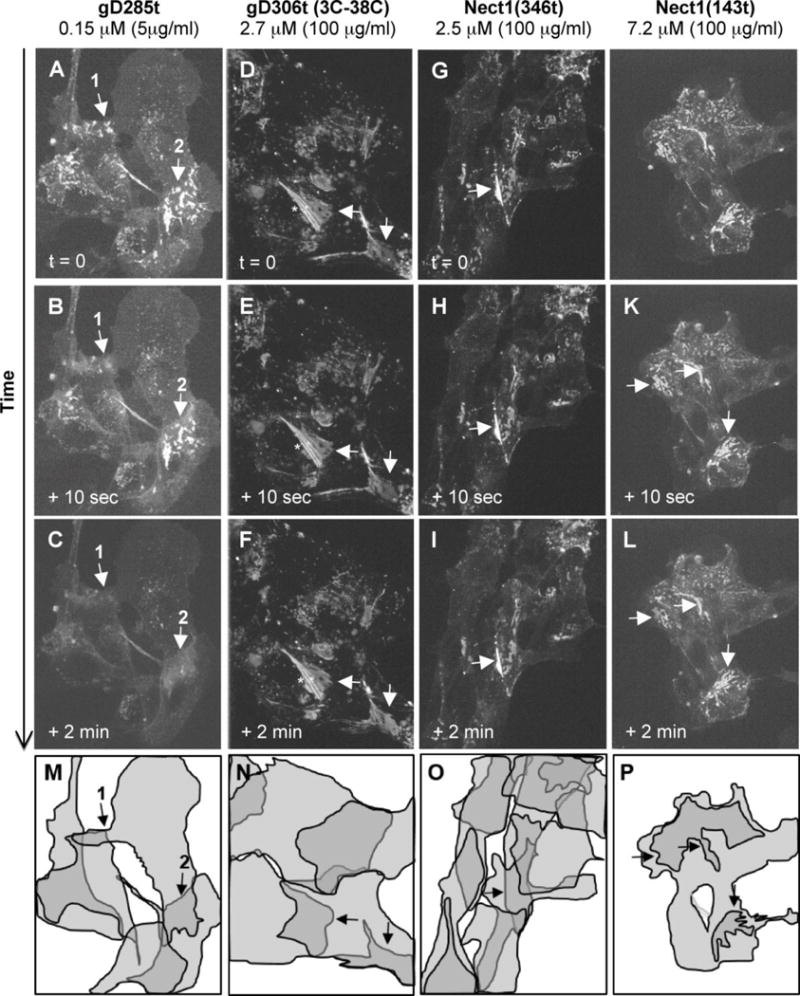
Figure 1. Relocalization of nectin-1-GFP in response to soluble gD.

Localization of nectin-1-GFP in B78-CG23 cells is indicated at different time points after the addition of the indicated purified forms of gD. Panels A, D, G and J show the typical pattern of nectin-1-GFP accumulation at contacts between overlapping cells (arrows) prior to the addition of gD. Only soluble gD(285t) led to changes in this accumulation pattern (A–C). Soluble non-binding gD(3-38C)306t (D–F), soluble nectin-1 ectodomain (G–I) and soluble nectin-1 V-domain (J–L) do not affect nectin-1-GFP patterns over time. Total projections of Z-sections are shown at each time point. Striation indicated by and asterisk is due to this projection of non-overlapping sections. Panels M-O indicate the position of major cells in the corresponding fields. These shapes represent the best approximations from 3D projections of the multiple confocal z-sections. The darker areas represent cell overlaps. In panel P, the overall shape of the cell cluster and the darker areas of cell contacts are indicated.
