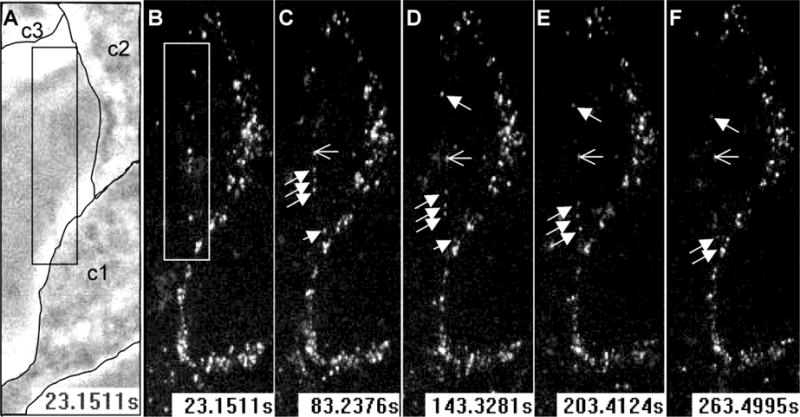
Figure 6.

HSV surfing on filopodia of nectin-1 expressing cells. HSV-K26 with GFP-tagged capsid was added to C10 cells about 3 min prior to recording. Images show the space between two cells (boxed in A and B) connected by a thin filopodium, which itself is not visible in contrast image (panel A) Three particles (filled arrows) move at the same speed and reach the lower cell where virions are already accumulating. The open arrow shows a fixed capsid for reference. The contours of unstained cells (c1, c2 and c3) are outlined in panel A and became visible in fluorescence fields as they accumulate GFP-tagged virions (B–F). Stacks of 3 confocal Z-sections are shown at each time point in the GFP channel (B–F). Time from the start of recording is indicated in seconds.
