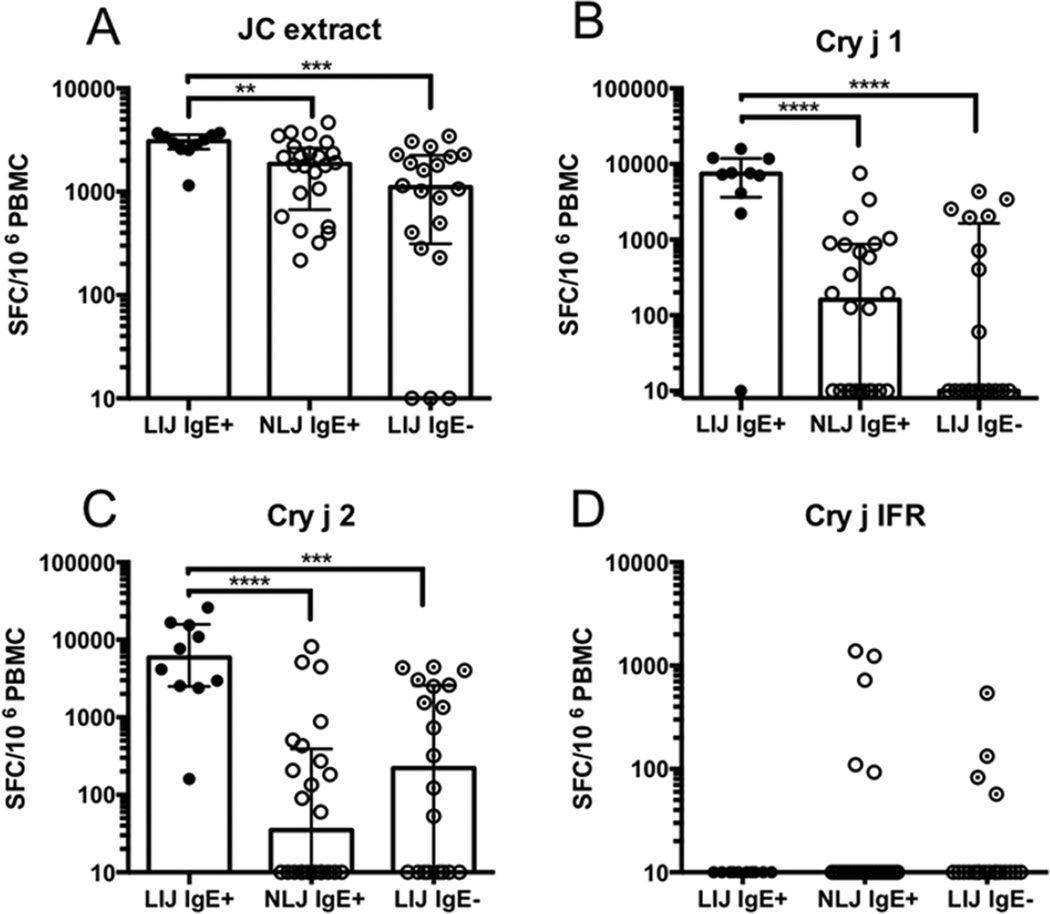
Figure 2.
Bar graphs depicting median values of total allergen-specific T cell responses (sum of IL-5 and IFNg responses to extract or individual peptides) to A) JC extract, B) Cry j 1, C) Cry j 2 and D) Cry j IFR in all 3 cohorts tested. Each symbol represents a single donor. Error bars indicate interquartile range. Statistical analysis was performed by Mann-Whitney test (non-parametric, two-tailed), **- p<0.01, ***- p <0.001, ****- p <0.0001. LIJ IgE+ cohort: N=10; NLJ IgE+ cohort: N=24; LIJ IgE− cohort: N=20

