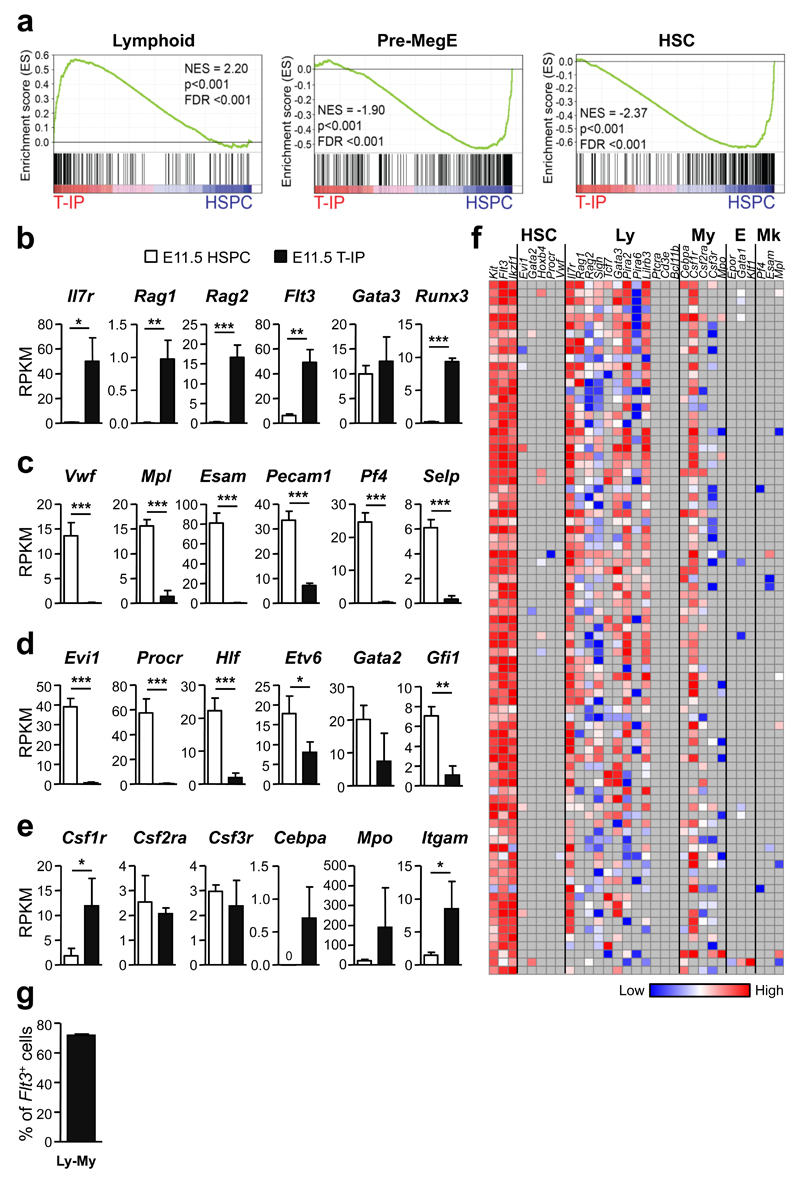
Figure 6. Molecular profiling of E11.5 thymopoiesis-initiating progenitors.
(a) Gene-set enrichment analyses of global RNA sequencing data from E11.5 CD45+Lin−c-Kit+CD25− Flt3+ T-IPs (n=3) versus E11.5 Lin−CD45loVE-Cad+c-Kit+ AGM stem/progenitor cells (HSPC) (n=3) for Lymphoid, Pre-MegE and HSC gene sets. NES, normalized enrichment score; FDR, false discovery rate.
(b-e) mRNA expression, shown as mean (s.d.) RPKM, of (b) early lymphoid (c) Mk (d) HSC and (e) GM affiliated genes in E11.5 T-IPs (n=3) and AGM HSPCs (n=3). *p<0.05, **p<0.01, ***p<0.001. n represents number of biological replicates.
(f) Heatmap for expression (ΔCt values, relative to Hprt) of lineage (HSC, hematopoietic stem cell; Ly, lymphoid; My, myeloid; E, erythroid; Mk, megakaryocytic) affiliated genes in single E11.5 CD45+Lin−c-Kit+CD25−Flt3+ T-IPs (n=85 cells, from 2 biological replicates, each using a pool of 5 and 9 embryos). Grey indicates not detected. Three cells were excluded due to absence of Flt3 amplification.
(g) Mean (s.d.) frequency of single E11.5 CD45+Lin−c-Kit+CD25−Flt3+ T-IPs co-expressing GM and lymphoid affiliated genes while not expressing Mk or E genes (from f). Only cells that amplified Flt3, c-Kit and Hprt (corresponding to 97% of total cells analyzed) were included. Flt3 and Gata3 were not considered as lymphoid in this analysis due to their concomitant non-lymphoid expression pattern.

