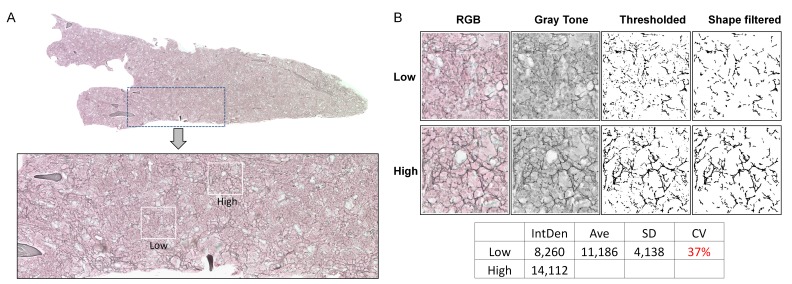
Figure 2.
Heterogeneous distribution of reticulin fibers within the bone marrow of Gata-1low mice. A. The upper image is a composite of 208 overlapping TIFF pictures (5626 KB each) along the whole diaphysis longitudinal axis length of the bone of a 30 week-old Gata-1low mouse (representative of 3 mice analyzed). The image was captured as 20 × magnification. The bone area in the digital image was erased to reduce the image size and simplify the view. The lower image is a zoom-in of the area framed in dotted lines within the upper image, revealing areas of low and high density of fibers, framed in white boxes. The distribution of high and low intensity fibers in the bone marrow (BM) seemed not to follow a firmly recognizable localization pattern. B. Representative low and high density areas were extracted from the image in panel A (3 × magnification) and converted to gray scale, thresholded and shape filtered to obtain the final images for reticulin quantification. As shown in the table under the images, the coefficient of variation (CV) for the 2 values of reticulin fibrosis (low and high) in this image is 37%. The equivalent result, after analyzing nearly 360 images scattered along sections of BM from 30 weeks old Gata-1low mice yielded a CV of 44% (as in Fig. 1).

