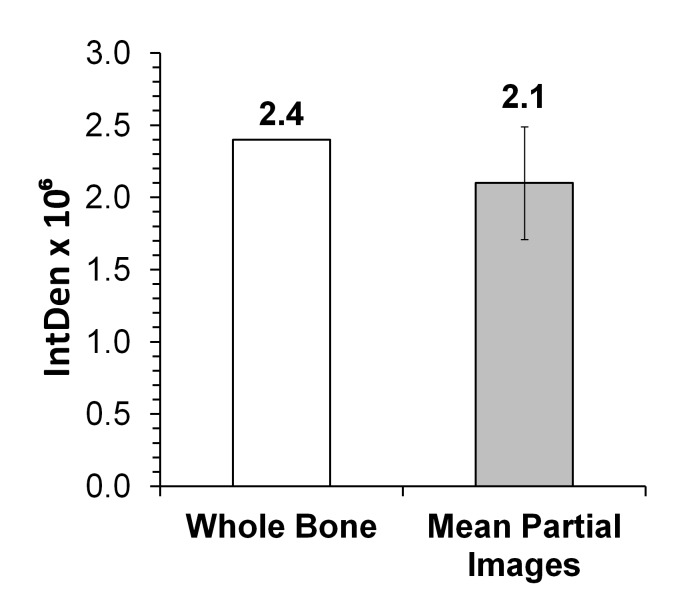
Figure 3.
Analysis of bone marrow section images. Composite images, which together cover bone marrow (BM) femur length, were analyzed. A representative 30 week old Gata-1low animal shown in Figure 2A (empty column) and seven images of the same BM (grey shaded column) were analyzed for Integrative Intensity (IntDen). Partial images covering an area of 1.92 × 10⁶ showed a mean IntDen of 1.3 × 10⁵. This value was scaled up to the total BM image area of 31.0 × 106 pixels by the following calculation: [(1.3 × 105) × (31.0 × 106)/1.92 × 106] to obtain the IntDen 2.1 × 10⁶ (grey shaded column). The numbers on top of the columns are IntDen.

