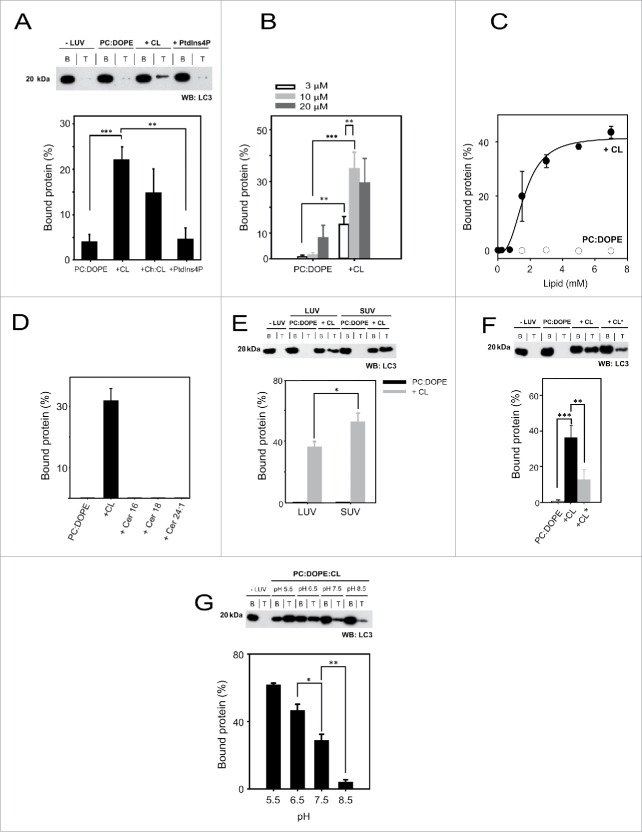
Figure 4.
LC3B interacts preferentially with CL-containing liposomes. The liposome-bound protein fraction was analyzed after flotation in a sucrose density gradient by SDS-PAGE/immunoblot analysis and quantified by densitometric integration of the dots. (A) 10 µM LC3B was incubated with 3 mM LUVs composed of either PC:DOPE (80:20 mol ratio), PC:DOPE:CL (50:20:30 mol ratio), PC:DOPE:Chol:CL (30:14:33:23 mol ratio) or PC:DOPE:PtdIns4P (50:20:30 mol ratio). Molecular mass is shown in kDa on the left-hand side. Data shown as mean ± SEM (n = 3); **P = 0.001 to 0.01, ***P< 0.001. (B) LC3B dose-dependence analysis using 3, 10 and 20 µM protein and 3 mM liposomes. Data shown as mean ± SD (n = 3); **P = 0.001 to 0.01, ***P < 0.001. (C) Protein:lipid ratio effect on LC3B binding to PC:DOPE or PC:DOPE:CL vesicles. The continuous line represents the best fit of the data, assuming an EC50 (half maximal effective concentration) of 1.65 ± 0.2 mM for binding to PC:DOPE:CL vesicles. Data shown as mean ± SEM from at least 3 independent experiments. (D) 10 µM LC3B was incubated with 3 mM LUVs composed of PC:DOPE (80:20 mol ratio), PC:DOPE:CL, PC:DOPE:Cer16, PC:DOPE:Cer18 or PC:DOPE:Cer24:1 (50:20:30 mol ratio). Data shown as mean ± SEM from at least 3 independent experiments. (E) 10 µM LC3B was incubated with 3 mM LUV or SUV to analyze vesicle size effect on the interaction. Data shown as mean ± SD (n = 3); *P = 0.01 to 0.05. (F) Comparison between heart bovine (CL) and E. coli (CL*) cardiolipins in the interaction. 10 µM LC3B was incubated with 3 mM LUV of either composition. Data shown as mean ± SD (n = 3); **P = 0.001 to 0.01, ***P < 0.001. (G) Effect of pH on LC3B (10 μM) binding to PC:DOPE:CL large vesicles (3 mM). Data shown as mean ± SEM (n = 3); *P = 0.01 to 0.05, **P = 0.001 to 0.01.

