Figure 8.
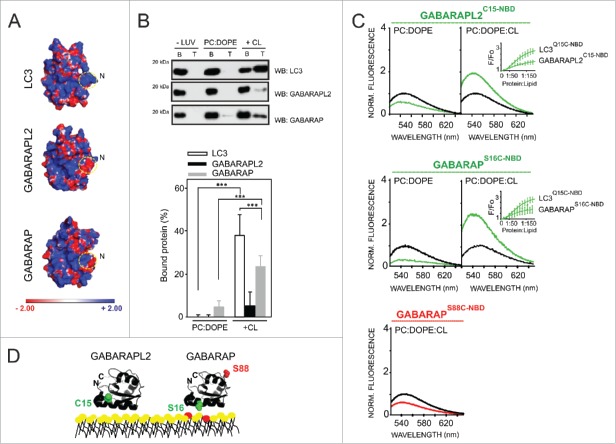
Different CL-interacting properties among human Atg8 orthologs. (A) Electrostatic potential surface of each LC3 ortholog in solution, calculated using the Poisson-Boltzmann equation and displayed with PyMOL. PDB: 1UGM (LC3), 1EO6 (GABARAPL2), 1GNU (GABARAP). (B) Each ortholog (10 µM) was incubated with 3 mM LUVs composed of PC:DOPE (80:20 mol ratio) or PC:DOPE:CL (50:20:30 mol ratio) followed by flotation of the liposomes by gradient centrifugation. Bound protein fraction was quantified by SDS-PAGE/immunoblot analysis using anti-LC3, GABARAPL2 and GABARAP antibodies. Molecular masses are shown in kDa on the left-hand side. Data shown as mean ± SD (n ≥ 3); ***P< 0.001. (C) Representative NBD fluorescence emission spectra of GABARAPL2C15-NBD and GABARAPS16C-NBD (1 µM) in the absence or presence of increasing amounts of liposomes containing PC:DOPE (80:20 mol ratio) or PC:DOPE:CL (50:20:30 mol ratio); and GABARAPS88C-NBD (1 μM) in the absence or presence of PC:DOPE:CL liposomes. In each case, fluorescence was normalized to the peak intensity of the protein spectrum in the absence of liposomes. (D) A structural model generated with PyMol is also shown depicting the 2 GABARAP residues that were individually mutated to cysteine obtaining single-cysteine GABARAP mutants and the endogenous cysteine of GABARAPL2. The environmentally sensitive fluorophore NBD was used to label each of these single cysteine residues. PDB: 1EO6 (GABARAPL2), 1GNU (GABARAP). CL is colored in red. Norm, normalized.

