FIGURE 2.

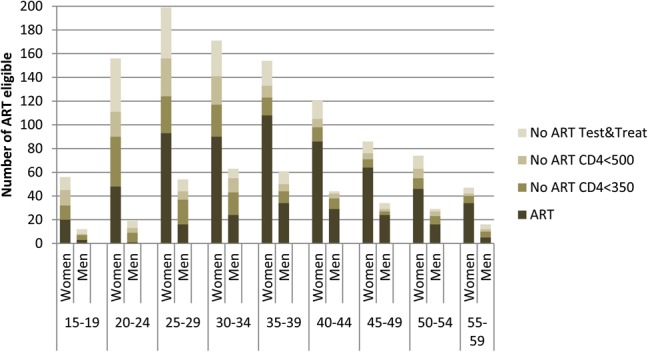
Number of HIV positives on ART and not on ART by gender and age group according to: national guidelines (CD4 < 350 and PMTCT B) at the time of the survey, 2013 WHO recommendations (CD4 < 500 and PMTCT B+), and test and treat strategy.

Number of HIV positives on ART and not on ART by gender and age group according to: national guidelines (CD4 < 350 and PMTCT B) at the time of the survey, 2013 WHO recommendations (CD4 < 500 and PMTCT B+), and test and treat strategy.