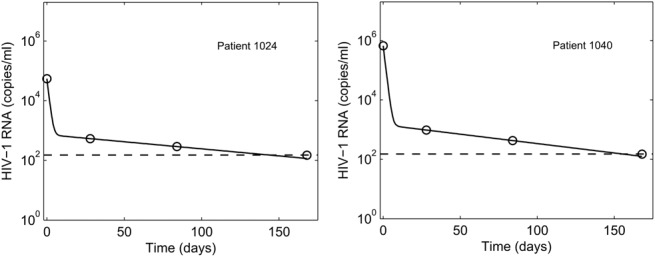
FIGURE 1.

Representative fits (solid lines) of our model predictions (Equation 7) to data (symbols) from 2 patients (left and right panels) of plasma HIV-1 RNA levels as a function of time following the onset of treatment. Dashed lines represent the limit of detection (150 copies/ml). Fits to all the patients analyzed are in Figures, Supplemental Digital Content 1 and Supplemental Digital Content 2, http://links.lww.com/QAI/A845. The resulting best-fit parameter estimates are in Table, Supplemental Digital Content 6, http://links.lww.com/QAI/A845.
