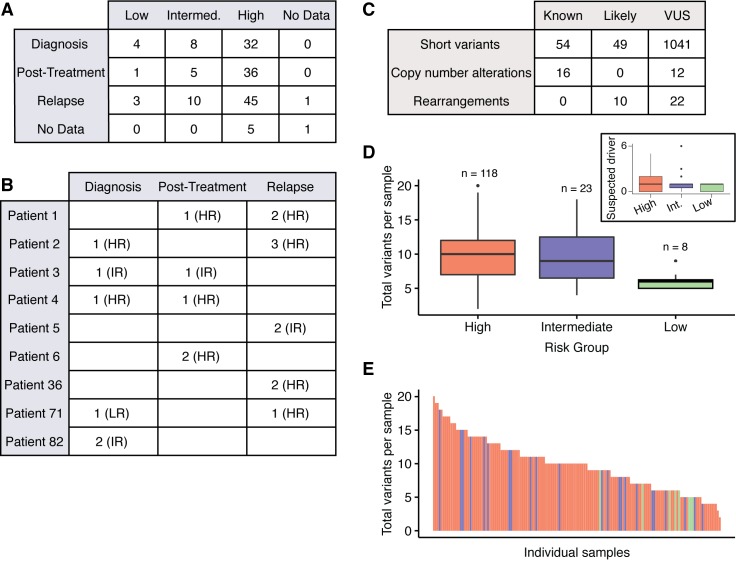
Fig 1.
Study cohort overview A) Tabulation of Children’s Oncology Group (COG) risk classification and treatment time points of biopsy for 151 samples. (Intermed. = intermediate risk group) B) Number of samples taken at each treatment time point for nine patients with serial biopsies. (HR = high risk, IR = intermediate risk, LR = low risk at time of biopsy; further information in S2 Table) C) Tabulation of all variants identified (VUS: variants of unknown significance) D) Total number of variants identified per sample, stratified by COG risk group. Inset shows a similar calculation for suspected driver variants only. Heavy line represents the median of the data. “n” indicates the number of patients in each risk group. E) Total number of variants in each sample. Each bar represents an individual sample; color corresponds to risk group (red = high, blue = intermediate, green = low).

