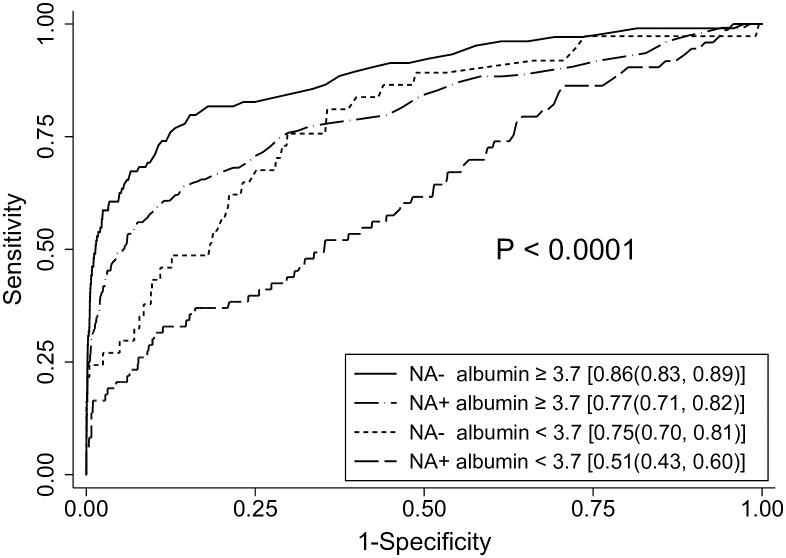
Fig 3. Receiver operating characteristic curves of AFP according to NA therapy status and concomitant albumin levels.
The C statistics with 95% confidence interval are presented in brackets. AFP tests showed best performance in patients without NA therapy during study period and when concomitantly measured albumin levels were ≥ 3.7 g/dL. In contrast, the C statistics were lowest in patients who received NA therapy during study period and when concomitantly measured albumin levels were < 3.7 g/dL.

