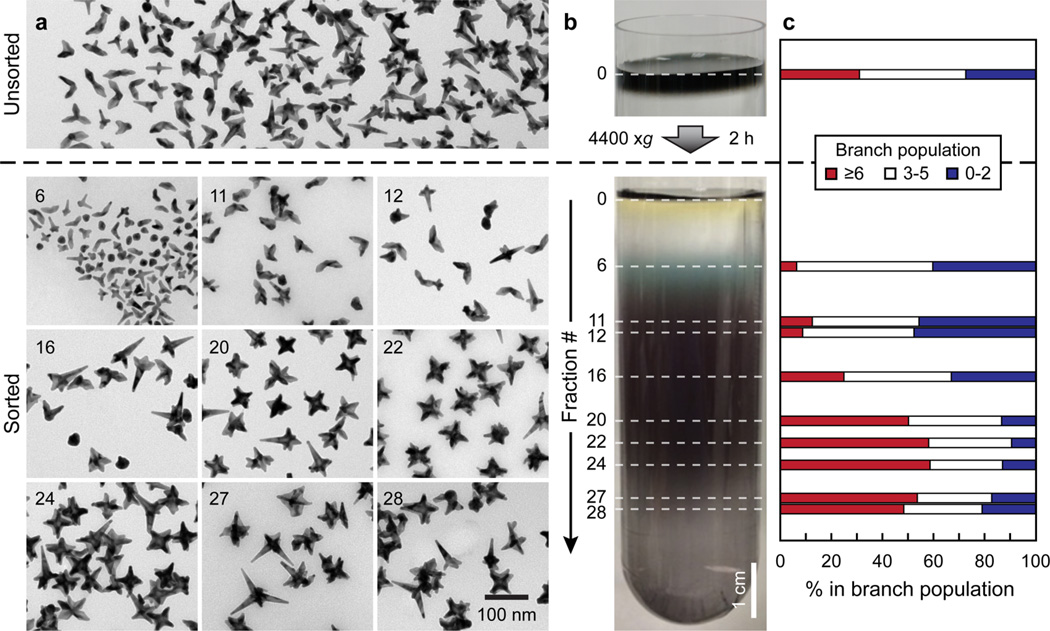
Figure 2.
DGC refines shape populations of DNA-Gd@stars. (a) TEM images of unsorted DNA-Gd@stars (top) and different fractions after DGC (bottom). (b) Photographs of a centrifuge tube before (top) and after (bottom) centrifugation of a concentrated nanostar solution in a sucrose linear density gradient. (c) Distribution of different DNA-Gd@star populations within each fraction based on branch counting of at least 400 particles per fraction.

