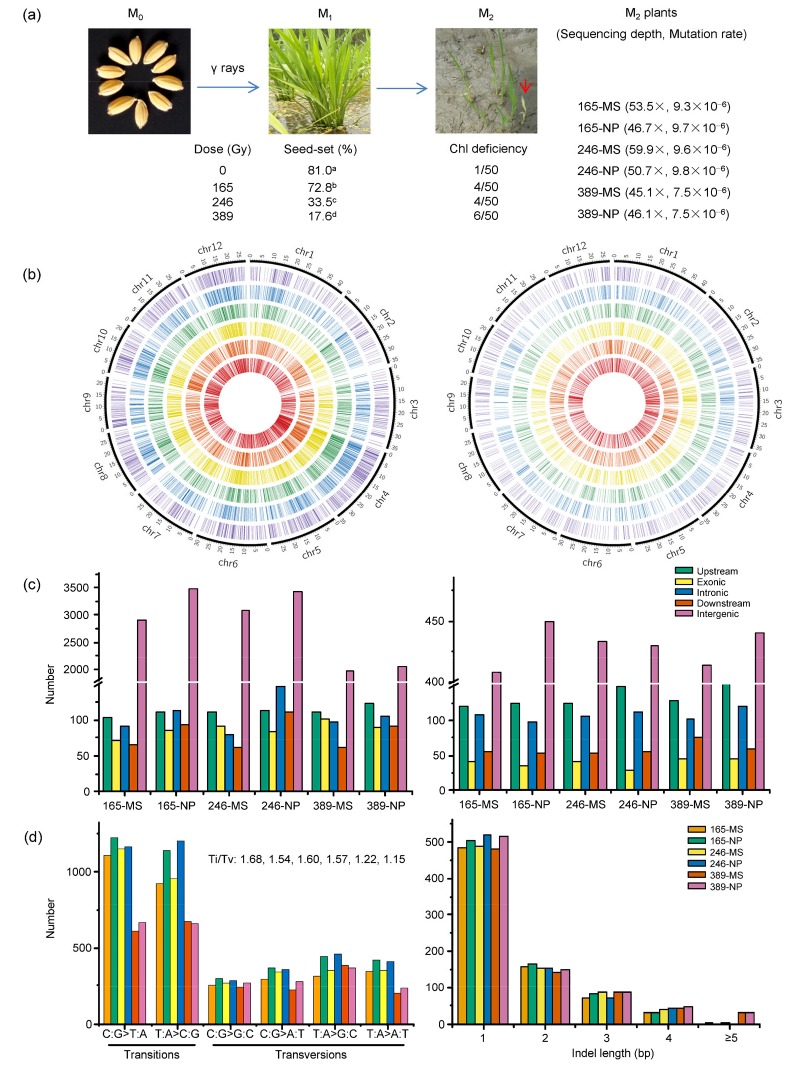
Fig. 1.
γ ray mutagenesis and genome-wide profiling of induced mutations in rice
(a) Treatment of rice seeds with γ rays at three absorbed doses: 165, 246, and 389 Gy. The effects of γ rays on seed-set in P1M1 and chlorophyll (Chl)-deficient mutation rates (the number of panicle rows with Chl-deficient seedlings among the total of 50 panicle rows at each dose) in P2M2 are shown. A red arrow indicates an albino seedling in one of the P2M2 panicle rows at the seedling stage. Six P2M2 plants (165-MS, 165-NP, 246-MS, 246-NP, 389-MS, and 389-NP) were selected for sequencing, with the sequencing depth and mutation rate per site of each plant shown within parentheses. Seed-set rates with different letters indicate significant difference (P<0.05) among P1M1 populations. (b) Distribution of mutations across 12 chromosomes in the genomes of the six P2M2 plants, which, from outside to inside, are 165-MS, 165-NP, 246-MS, 246-NP, 389-MS, and 389-NP, respectively. Each radiating line stands for a mutation position of a single base substitution (SBS) (left) or an insertion/deletion (Indel) (right). (c, d) Molecular spectra of γ ray-induced mutations: (c) frequencies of substitution (left) and Indel (right) mutations located in the different genomic regions of the six P2M2 plants; (d) frequencies of specific types of SBS with the transitions/transversions (Ti/Tv) ratios shown in sequence (left), and frequencies and sizes of Indel mutations identified (right) in the six P2M2 plants

