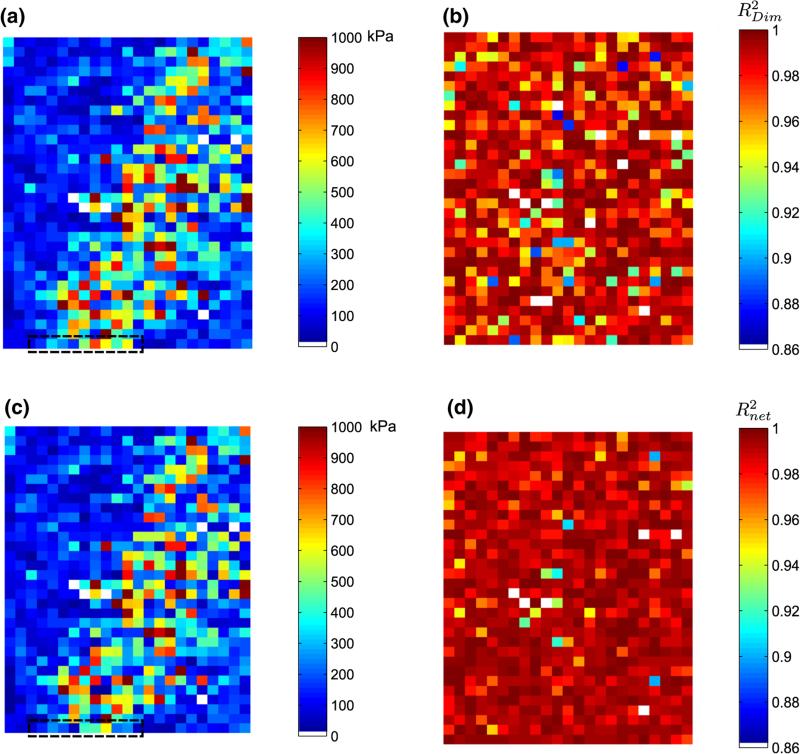
FIGURE 12.
Implementation of the proposed algorithm for automated characterization on a tissue ROI shown previously in Fig. 1b. (a) Elastic map using the Dimitriadis model only without any Inverse FE corrections, (b) Corresponding fit, (c) Elastic map (Ê) with inverse-FE correction, (d) Corresponding fit, where . White spaces indicate uninterpretable force curves that were not analyzed.

