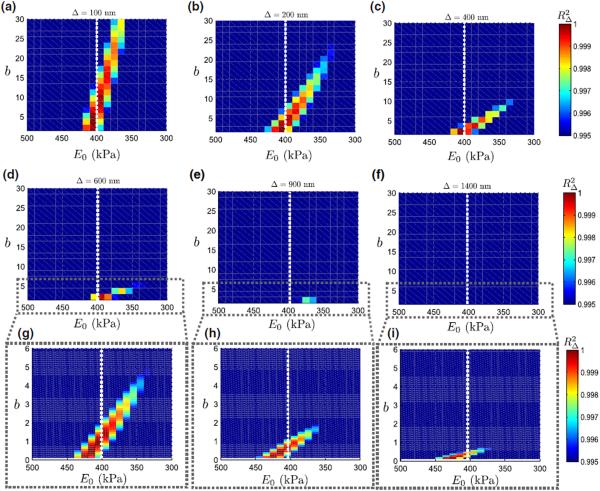
FIGURE 8.
Sensitivity of the Fung model parameters at varying indentations. (a) Δ = 100 nm, (b) Δ = 200 nm, (c) Δ = 400 nm, (d) Δ = 600 nm, (e) Δ = 900 nm and (f) Δ = 1400 nm. Also shown in the third row (g–i) are enlarged figures of (d–f) where the range of b is reduced to 1 – 6. The white dotted line at 400 kPa indicates the elastic modulus of the linearly elastic material.

