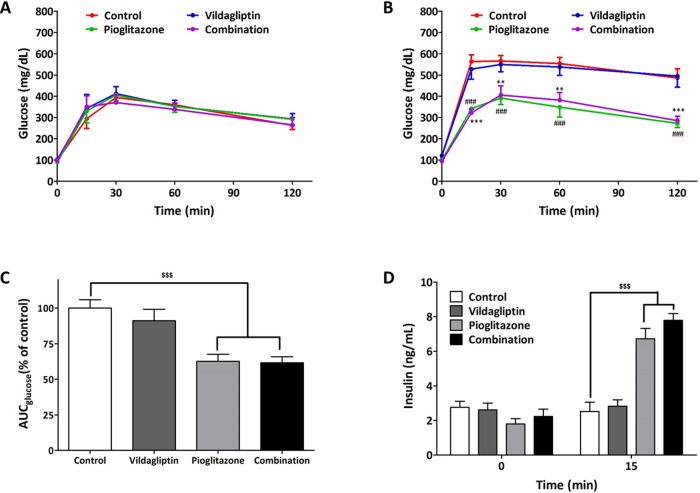
Fig 2. Glucose profile and insulin secretion after 5-week treatment in ZDF rats.
(A) Glucose profile in IPGTT (glucose 2g/kg) before treatment (B) Glucose profile in IPGTT (glucose 2 g/kg) after treatment with control, vildagliptin (10 mg/kg/day), pioglitazone (30 mg/kg/day), and combination (vidalgliptin 10 mg/kg/day and pioglitazone 30 mg/kg/day). (C) AUC of glucose during the IPGTT after treatment (D) serum insulin level at 0 and 15 min in IPGTT after treatment. All data represented as Mean ± SD. **p < 0.01 and ***p < 0.001 (combination group) and ### p < 0.001 (pioglitazone group) compared with control group. $$p < 0.01, $$$p < 0.001 compared with control group.

