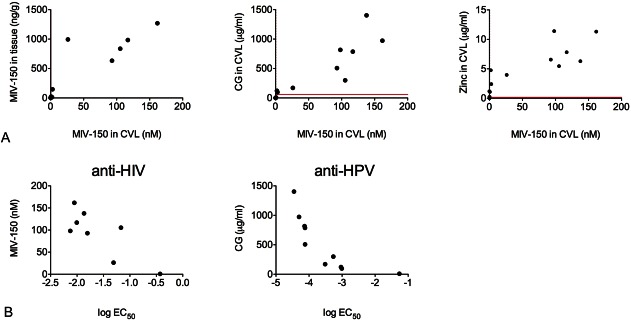
FIGURE 2.
Correlation of active pharmaceutical ingredient levels with each other, in different compartments, and their respective antiviral activity. A, Concentrations of MIV-150 in plasma, CVL, and tissue were determined using LC-MS/MS, Zn2+ in plasma and CVL using ICP-MS, and CG in CVL using ELISA. Lines parallel to x-axis and y-axis are the lower limit of quantitation for each API/compartment. B, API concentrations were determined as described above; antiviral activity was determined using the TZM-bl and luciferase assays for anti-HIV-1 and anti-HPV16 PsV activity, respectively. The graphs show the log EC50 values for each sample versus API concentration.

