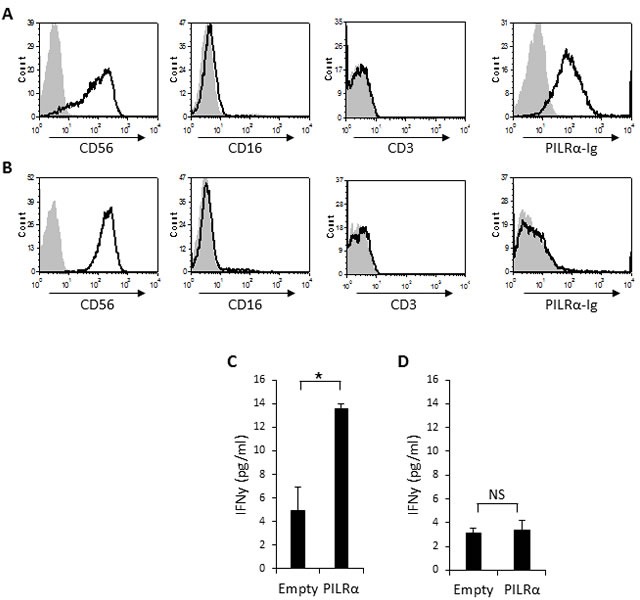
Figure 3. PILRα-Ig binds some CD56 bright NK clones and causes IFNγ secretion.

A., B. FACS staining of isolated CD56bright, CD16negative, CD3negative NK clones. Grey filled histograms are background control staining. Black line histograms represent specific staining, as indicated. (A) PILRα-Ig positive NK clone. (B) PILRα-Ig negative clone. C., D. IFNγ secretion by PILRα-Ig positive NK clones (C) and by PILRα-Ig negative NK clones (D) following incubation with 721.221 cells transfected either with an empty vector as control, or with PILRα. Figure combine 3 independent experiments. *p < 0.05, NS-not significant. Statistics was performed using student T-test.
